The United States dominates global private equity, just as it dominates the world economy and global finance. But by how much? Depending on the source, the US market is either 1.6 times or four to five times the size of Europe’s. This first part measures the gap, looks at what drives it — the very largest deals, public intervention, business angels — and explains why the numbers diverge.
Introduction — America’s economic and financial power
Since the 2008 financial crisis, the economic paths of the United States and Europe have steadily drifted apart. The two blocs still carried comparable economic weight at the start of that period; since then, the United States has widened its lead in wealth creation, in the valuation of its companies and in the depth of its financial markets.
In 2025, US gross domestic product reached about $30,770 billion, against $21,232 billion for the European Union1. In nominal dollar terms, the US economy is now nearly 45% larger than that of the 27 EU member states. The contrast is all the more striking because the European Union has about 450 million inhabitants, against 342 million in the United States. GDP per capita is close to $90,000 in the United States, against $47,000 in the European Union1.
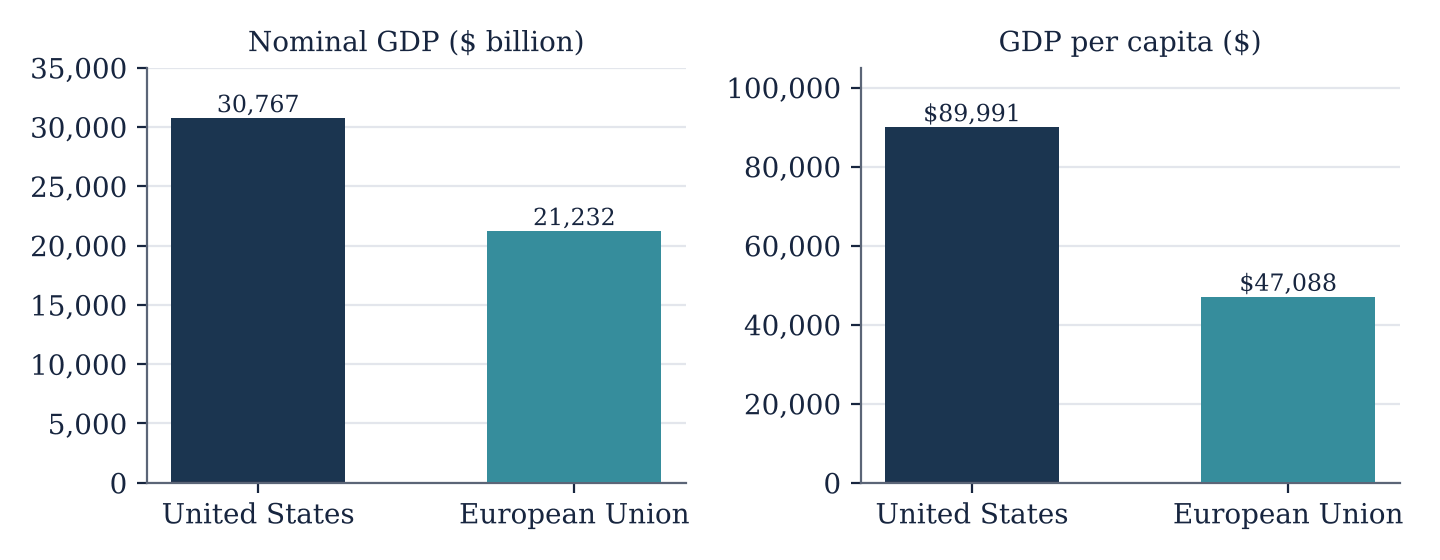
Source: IMF, World Economic Outlook, April 2026. Nominal values in current dollars.
These gaps must be read with care: exchange rates, purchasing power parities, demographics and hours worked all affect the comparison. They nonetheless reflect a considerable economic divergence, driven by differences in productivity, investment and sector specialization.
Recent growth confirms the trend. In 2025, US real GDP grew by about 2.2%, against 1.5% in the European Union2. The United States benefits from an integrated domestic market, greater mobility of capital and labor, and a financial environment that is particularly supportive of business growth.
The dominance is even more visible in equity markets.
From December 31, 2015 to December 31, 2025, the S&P 500 rose 235%, or 12.8% a year, against 62% for the STOXX Europe 600, or 4.9% a year. Measured in dollars, the European index gained 75%, as the euro rose from $1.0887 to $1.1750 over the period. The Nasdaq-100 rose 450%, or 18.6% a year, carried by the large technology companies. These figures refer to price indices, excluding dividends; with dividends reinvested, the S&P 500 gained 298%.3
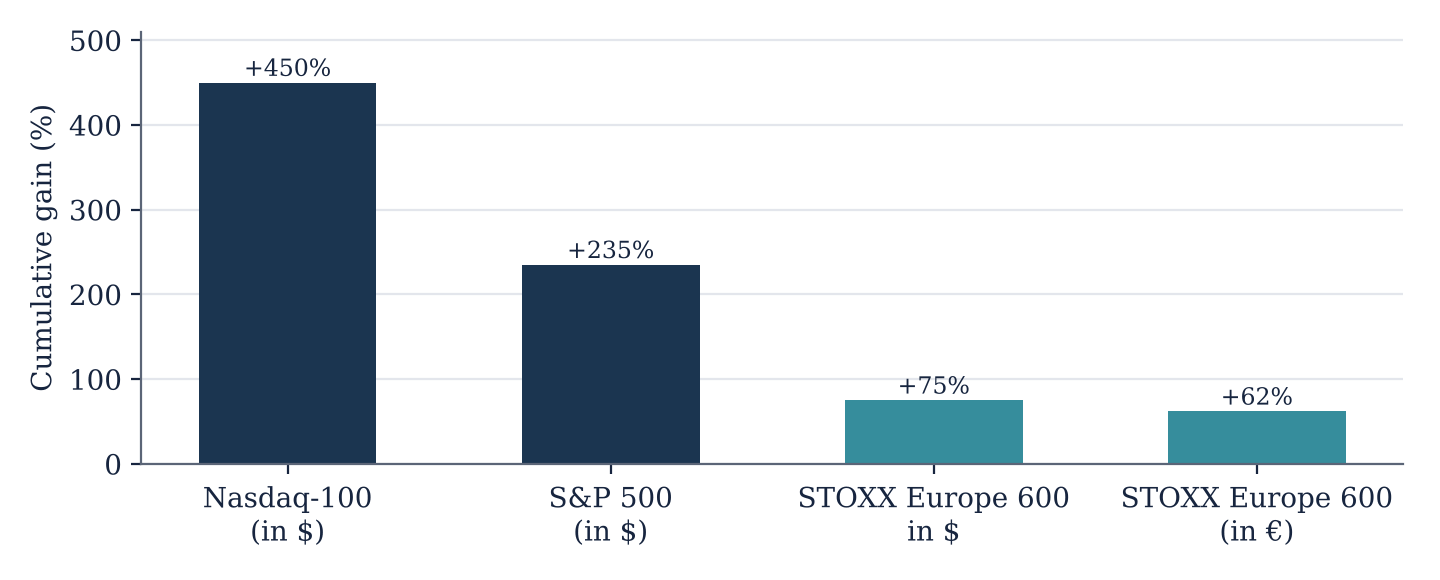
Source: Price indices, excluding dividends, calculated from year-end closing levels; STOXX Europe 600 converted at ECB reference rates ($1.0887 and $1.1750 per euro). With dividends reinvested, the S&P 500 gained 298%.
The difference is not only a matter of company performance. It also reflects a deep difference in sector mix. The United States is home to most of the world leaders in software, semiconductors, digital platforms, the cloud and now artificial intelligence. Europe still has powerful industrial, pharmaceutical, financial and consumer groups, but far fewer technology companies with very large market capitalizations.
Market capitalization figures illustrate this concentration. At the end of 2025, according to SIFMA, US equity markets were worth about $68.9 trillion, or 43.7% of global market capitalization, estimated at $157.8 trillion4.
America’s financial power goes well beyond the stock market. The United States has the deepest bond market, a highly developed syndicated loan market, a private credit industry able to finance multibillion-dollar acquisitions, and an exceptional base of institutional investors. Public and private pension funds, university endowments, insurers and asset managers form a pool of capital whose allocation capacity has no equivalent in continental Europe.
This financial depth creates a self-reinforcing cycle. American companies can access larger financing, grow faster, make bigger acquisitions and exit through more liquid markets. Investors, in turn, have a wider universe and a more diverse range of financing instruments.
Private equity is a natural part of this ecosystem. Most of the world’s large private equity firms were born and grew up in the United States. Blackstone, KKR, Apollo, Carlyle and TPG have built global platforms whose activities now reach far beyond buyouts. Europe has also produced major international firms, among them CVC, EQT, Ardian, Permira, Cinven and PAI Partners, but their size, financial environment and access to capital generally differ from those of the large American groups.
American dominance in private equity is therefore no anomaly. It mirrors the dominance of the US economy and financial system. What remains is to measure it precisely — because private equity statistics have a rarely noted feature: depending on the source, the scope and the method, the same market can show very different sizes. That is what this analysis sets out to do, using data for 2025 and the first nine months of 2026.
I. Two markets of very different size, and hard to compare
US private equity is far larger than its European counterpart. The difficulty lies less in that finding than in measuring the gap precisely.
According to PitchBook, US private equity deal value reached $1,155.5 billion in 2025, across 9,019 deals. In Europe, the same provider counts €645.3 billion across 9,001 deals5. Converted at the 2025 average exchange rate, these figures give a ratio of 1.6 between the two markets6.
This comparison has the advantage of a consistent methodology: both figures measure estimated enterprise values, including debt; both include add-on acquisitions made by portfolio companies; and both exclude US VC and European venture capital. The number of deals is almost identical on both sides of the Atlantic, while their total value differs considerably. The gap therefore comes from deal size rather than deal count.
A more complete comparison brings US VC and European venture capital back into the figures. In 2025, PitchBook records $339.4 billion invested in VC in the United States and €66.2 billion in venture capital in Europe7. Private equity including VC thus reaches $1,494.9 billion in the United States, or about €1,323 billion, against €711.5 billion in Europe, venture capital included. On that basis, the US market is 1.86 times the size of Europe’s6 — still far below the four-to-five-times gap sometimes put forward on the basis of different statistical sources.
The split by segment matters, however. Excluding VC and venture capital, the ratio is 1.58; between US VC and European venture capital, it reaches 4.546. The transatlantic gap is therefore much wider in the financing of young companies than in the acquisition of established ones.
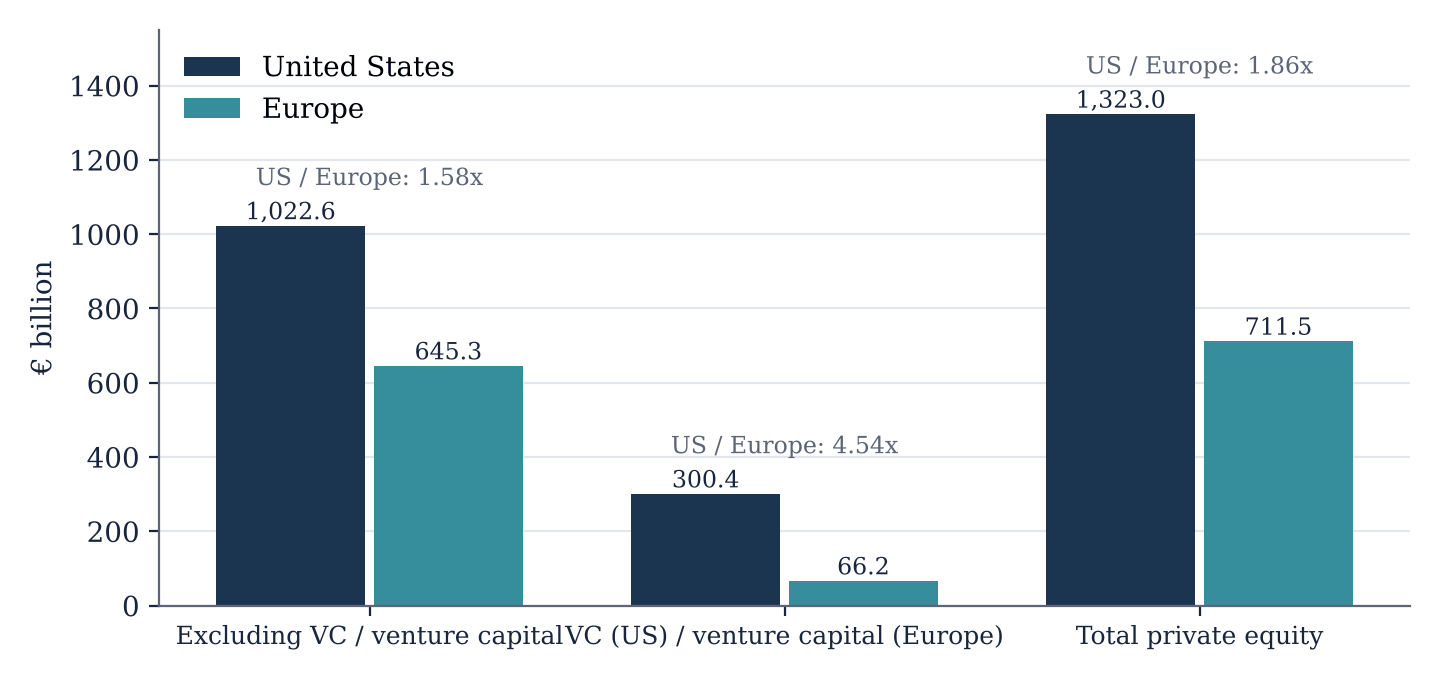
Source: PitchBook, 2025 Annual US PE Breakdown and 2025 Annual European PE Breakdown; PitchBook-NVCA Venture Monitor Q4 2025 and 2025 Annual European Venture Report; converted at the 2025 average rate of $1.130 per euro. Composite indicator: enterprise values for buyout and growth, funding rounds for VC and venture capital.
This sum should be read as a composite indicator of activity: buyout statistics mostly measure enterprise values, including debt, while VC and venture capital statistics measure the capital raised in funding rounds.
These amounts do not match those PE Research has previously published for European venture capital — for instance €13 billion in 2023 in analysis No. 2 (in French). The difference is one of scope: Invest Europe measures only the equity invested by venture capital funds (€20 billion in 2025), whereas PitchBook measures the total value of funding rounds, all investors combined — funds, corporates, business angels and public investors8.
Another comparison, widely quoted, sets the US figure of $1,155.5 billion against the €260.9 billion published by Invest Europe for 2025, which suggests a US market four to five times larger. But the two figures do not measure the same thing. PitchBook estimates the total value of the companies acquired, including debt and deals whose price is not disclosed. Invest Europe records the capital allocated to transactions reported by the firms that take part in its statistical program, and its scope also includes venture capital. Once venture capital is removed, the European figure published by Invest Europe falls to €225.6 billion, against €645.3 billion at PitchBook9. The gap between the two sources is considerable; it stems mainly from deal coverage, the treatment of add-on acquisitions and estimation methods.
The comparison thus reveals two realities: American dominance is beyond dispute, but its scale depends heavily on the yardstick used.
II. The largest deals: where American dominance is clearest
The difference between the two markets stands out most sharply in the largest transactions in history. The United States dominates the giant acquisitions by a wide margin, thanks to the size of the companies available, the depth of bank and bond financing, and the ability of sponsors to form consortiums that mobilize tens of billions of dollars.
The historical ranking of the largest buyouts illustrates this concentration. The acquisitions of TXU Energy, HCA Healthcare, RJR Nabisco, First Data and Hilton Hotels each marked a stage in the development of the American industry. More recently, the take-private of Electronic Arts, valued at $55 billion, shows that the US market can still put together transactions of exceptional size10.
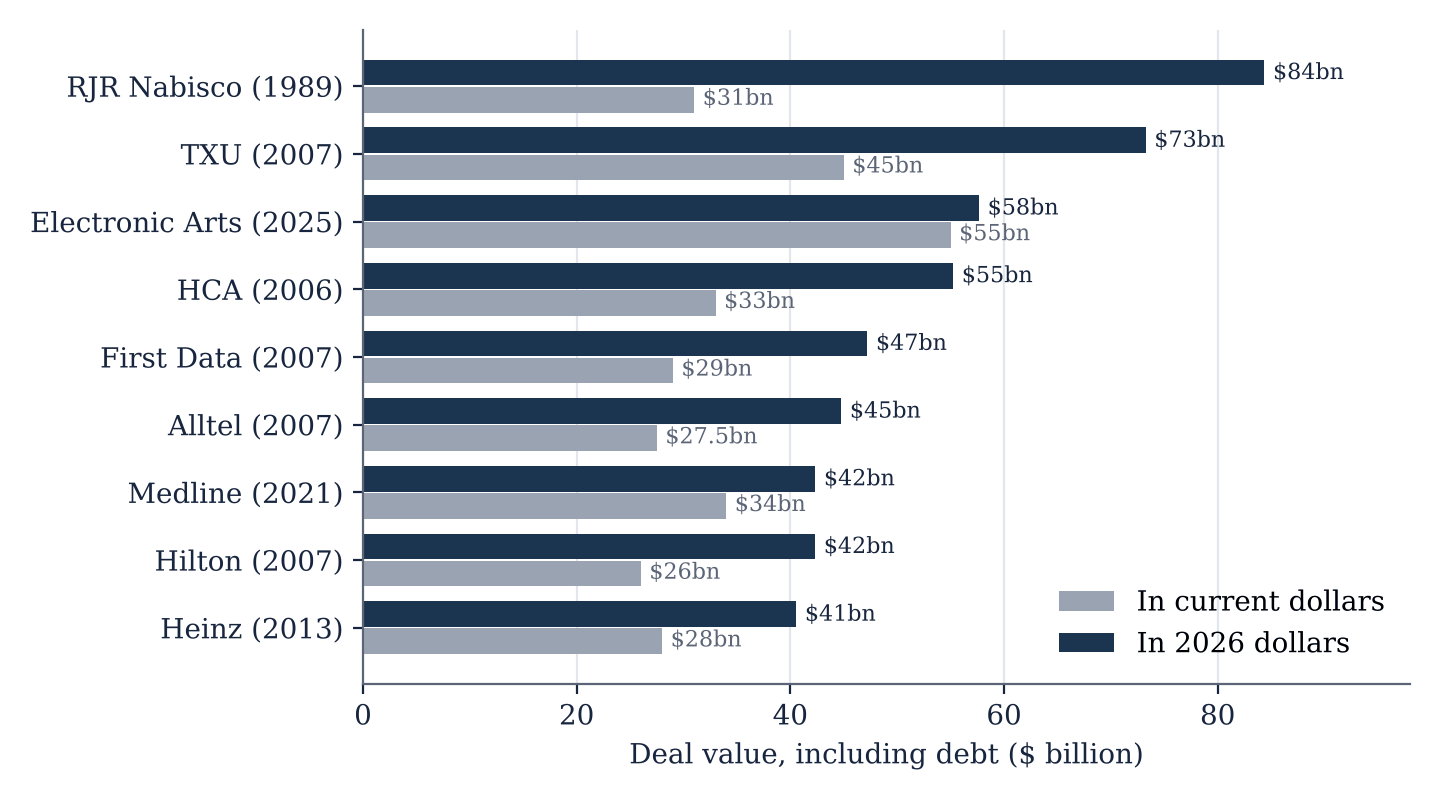
Source: Announced values, including debt, from the Dealroom compilation “Largest Leveraged Buyouts in History” (2026); Electronic Arts: PitchBook, 2025 Annual US PE Breakdown ($55 billion; Bain reports $56.6 billion). Conversion to 2026 dollars: Bureau of Labor Statistics CPI-U, average for the year of the deal relative to October 2026 (337.511), i.e. a factor of 2.72 for 1989, 1.67 for 2006, 1.63 for 2007, 1.45 for 2013, 1.25 for 2021 and 1.05 for 2025. RJR Nabisco: agreement reached in late 1988, deal completed in 1989 (CNBC dates it 1988). Values vary by source: CNBC, using Dealogic data, reports lower figures (TXU $32.1 billion, HCA $21.2 billion) and lists Alliance Boots (KKR, 2007, $19.6 billion) as the largest European deal.
The phenomenon is even more spectacular in VC. The large funding rounds of OpenAI, Anthropic and xAI have reached amounts that would have been hard to imagine for young companies only a few years ago. Meta’s stake in Scale AI ($14.3 billion in June 2025), often listed among them, follows a different logic: a strategic investment by a corporate in a supplier, not a funding round11. These deals reflect the concentration of American capital on technology, and above all on artificial intelligence.
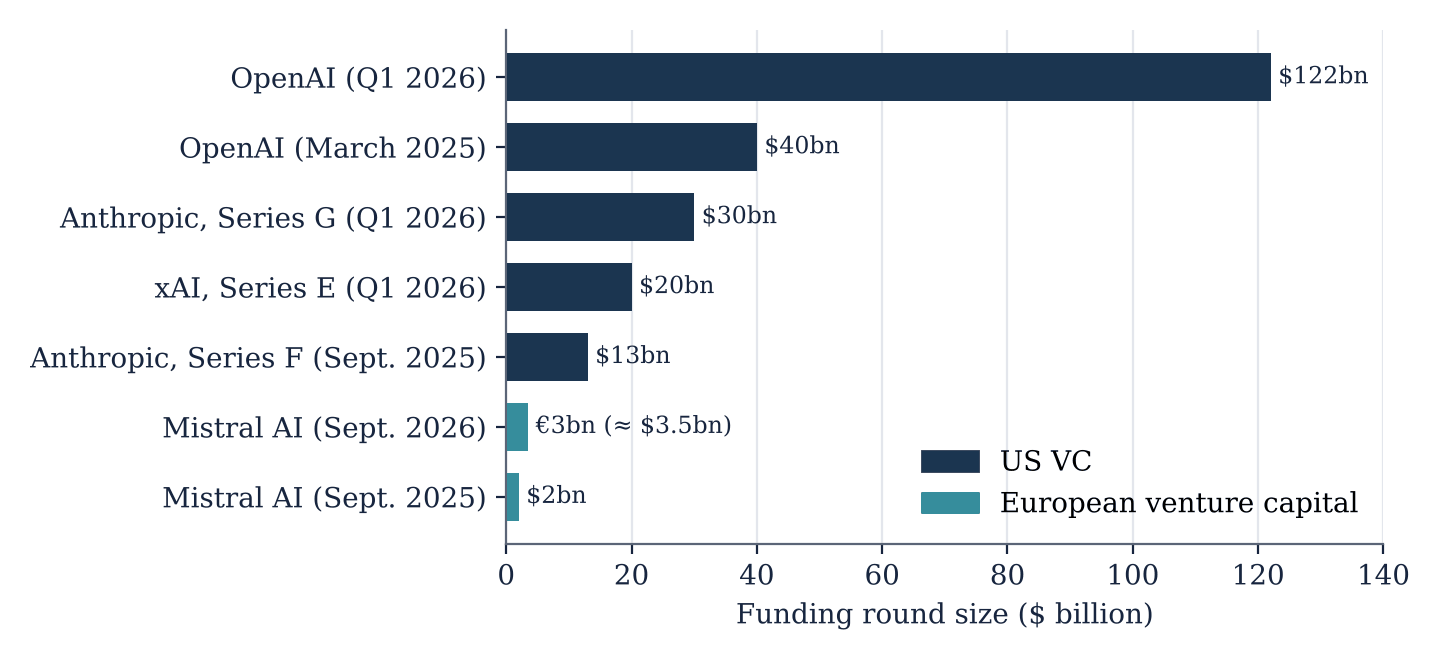
Source: Crunchbase News, “Largest funding rounds of 2025” and “Foundational AI startup funding, Q1 2026”; Mistral AI, September 2026: PitchBook, Q3 2026 European Venture Report, p. 4 (€3 billion, converted at $1.163). OpenAI’s Q1 2026 round was announced at $110 billion and raised to $122 billion on March 31. Only funding rounds are shown: Meta’s strategic stake in Scale AI ($14.3 billion, June 2025), a transaction of a different nature, is excluded.
American dominance is therefore particularly strong at the top of the deal distribution.
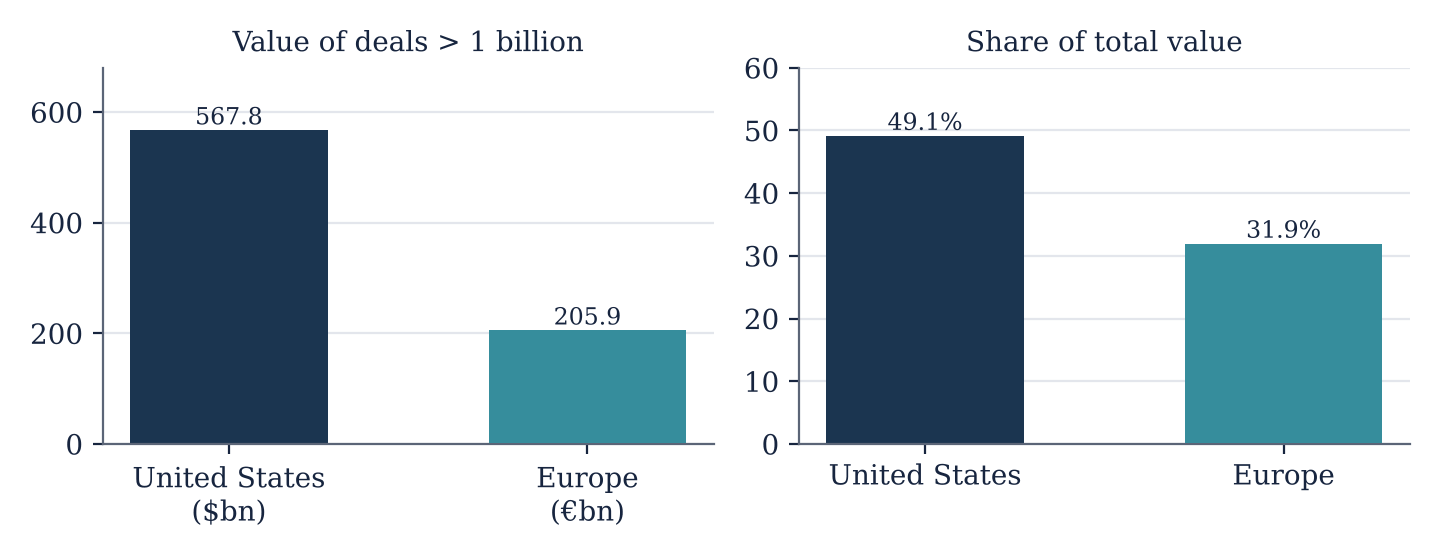
Source: PitchBook, 2025 Annual US PE Breakdown (150 deals, $567.8 billion) and 2025 Annual European PE Breakdown (31.9% of value; amount calculated as 31.9% × €645.3 billion). Thresholds of $1 billion and €1 billion; different currencies.
Europe retains a substantial industry among mid-sized companies and in buy-and-build strategies, but acquisitions worth tens of billions of dollars remain far more common in the United States.
III. Washington behind the scenes: the SBA and its SBICs
American dominance does not owe everything to the market. It also owes something to public programs — the oldest of which, little known in Europe, is almost as old as venture capital itself.
The Small Business Administration (SBA) is the federal agency responsible for small businesses. In 1958, the Small Business Investment Act gave it an original mission: to license Small Business Investment Companies (SBICs). These are private funds, run by private teams, that invest in small American businesses. What sets them apart is how they are financed: for every dollar raised from private investors, an SBIC can borrow up to two dollars through debentures guaranteed by the federal government, up to $175 million per fund and $350 million per family of funds; private capital must be at least $5 million12. In this program, the government does not invest in the funds itself: it guarantees their borrowing, which allows SBICs to borrow on far better terms than they could obtain on their own in the market. The managers it licenses choose their investments and bear the risk.
The program has grown considerably. As of June 30, 2025, 336 SBICs held an active license; together, they had invested or committed more than $44 billion in small businesses, about $25 billion of it from the SBA12. For fiscal year 2025, the SBA reported a record $53 billion of combined private capital and SBA leverage, against $46 billion the year before, along with 48 new licenses and 86 pre-approvals13. According to the SBA’s Inspector General, the program has operated at zero subsidy cost to taxpayers for more than twenty years, with a near-zero default rate over the past five years12.
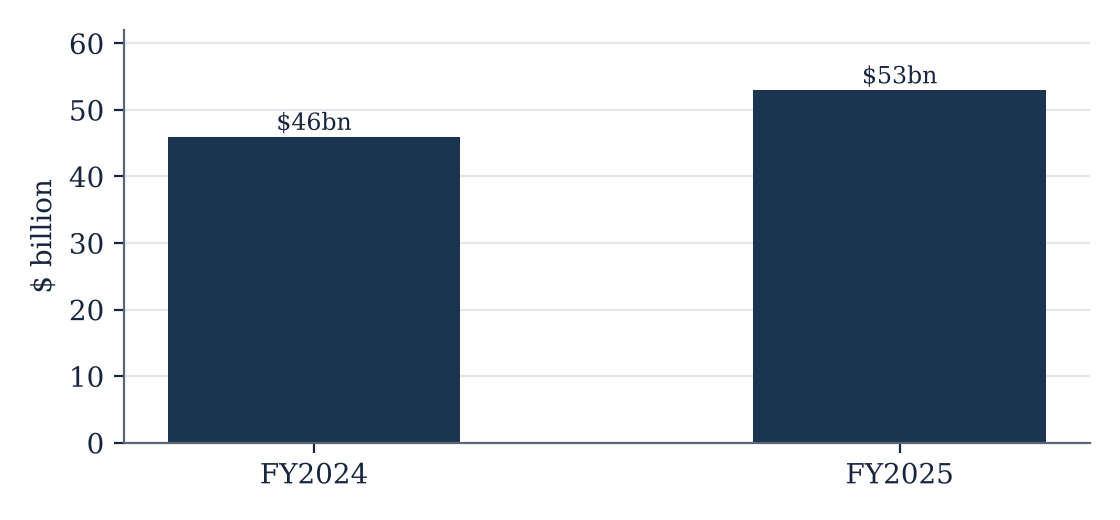
Source: SBA press release, November 19, 2025 (federal fiscal years ending September 30).
Its historical weight goes beyond these figures. In the 1960s, SBICs were one of the first channels of American venture capital, and the SBA cites Apple, Intel, FedEx and Costco among the companies they financed in their early years14. Today, the program mainly serves the lower end of the market: funds that are small, given the caps, and that finance companies the large funds do not look at.
The SBIC is only one tool among others, however, and US public intervention is not limited to lending. The federal government directly funds small-business research through grants and contracts that take no equity: the SBIR and STTR programs, funded by a mandatory 3.2% and 0.45% share of the external research budgets of the large federal agencies, awarded just over $5 billion in 202215. It finances venture capital programs through the states: the SSBCI program, with close to $10 billion in 2021, allows them to fund equity programs as well as loan guarantees16. It occasionally takes direct stakes: in August 2025, it became a shareholder of Intel with about 9.9%, for $8.9 billion, by converting grants already awarded17. The Pentagon, through its Office of Strategic Capital, lends to companies and to investment funds focused on critical technologies18. Finally, the leading investors in American funds are often public themselves: state and local pension funds, to which PE Research devoted analysis No. 11 (in French).
Europe, for its part, does more than invest in funds: France’s Bpifrance lends and provides guarantees, and the European Investment Fund manages guarantees on behalf of the European Union. But when it comes to financing venture capital funds, public intervention in Europe mainly takes the form of equity commitments — the European Investment Fund, Bpifrance, KfW Capital — and it carries a lot of weight: in 2025, government agencies provided 39% of the €17 billion raised by European venture capital funds, or about €6.6 billion, a rising share19. The contrast between a US government that lends and a European government that invests therefore holds for one tool — the financing of fund managers. It does not sum up all public intervention on either side of the Atlantic.
IV. Before VC: business angels
Comparisons of private equity markets leave out the first link in the financing of young companies: business angels, the individuals who invest their own money in start-ups. PE Research devoted analysis No. 13 to them; the data published since make it possible to update the orders of magnitude.
In the United States, the University of New Hampshire’s Center for Venture Research estimates that business angels invested $17.9 billion in 2024, down 3.1% year on year, in 55,346 companies, through 445,535 active investors, up 5.5%20. The market has contracted since 2022: $18.6 billion in 2023, down 16.4% from 202220.
In Europe, the European Business Angel Network (EBAN) only tracks the “visible” market, that of organized networks: €1.22 billion invested in 2024 across 39 countries, down 2.8%, in 4,582 funding rounds, by about 47,600 business angels who belong to networks; the United Kingdom (€291 million), Germany (€162 million) and France (€131 million) lead21. EBAN no longer publishes an estimate of the total market, invisible part included.
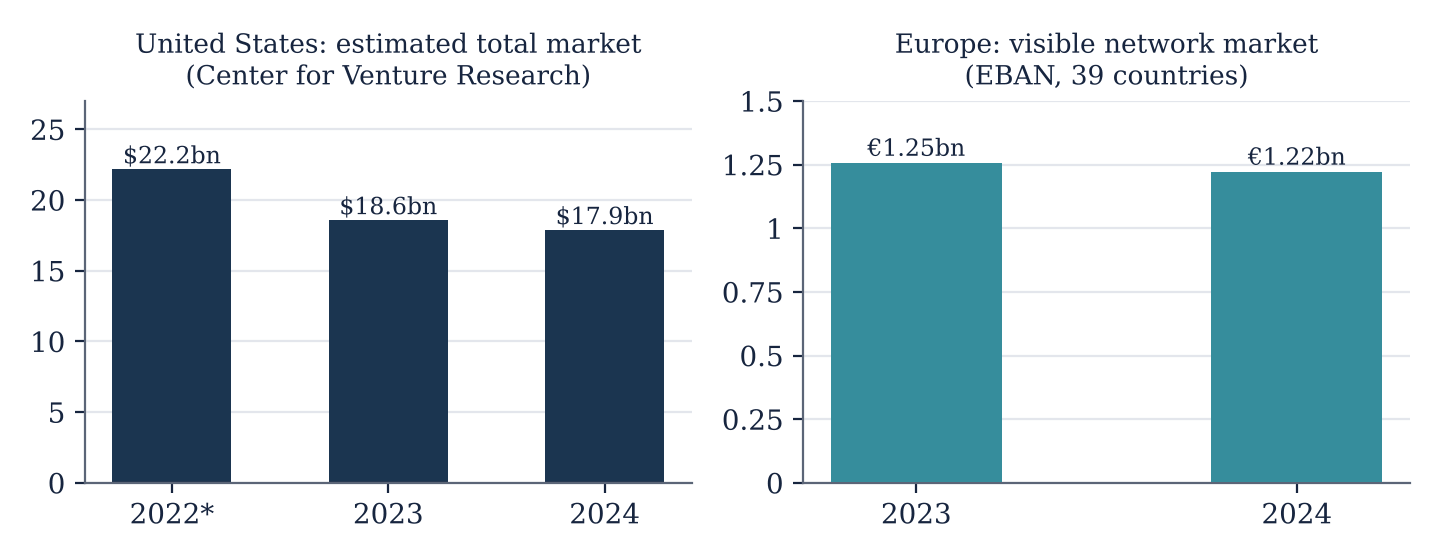
Source: University of New Hampshire, Center for Venture Research, 2023 and 2024 reports (* 2022: amount calculated from the 16.4% decline reported for 2023); EBAN, Statistics Compendium 2024. The two measures are not comparable: estimated total market in the United States, network-only count in Europe.
These two figures cannot be set side by side to calculate a ratio: the American one is an estimate of the whole market, the European one a partial count. They nonetheless confirm what analysis No. 13 attributed to tax policy — the capital gains exemption on Qualified Small Business Stock in the United States, the SEIS and EIS schemes in the United Kingdom, the IR-PME income tax reduction in France — and to the culture of founders reinvesting their gains, and what it summed up as follows: systemic in the United States, marginal in Europe.
In summary
American dominance in private equity is real, but its scale depends on the yardstick: 1.6 times the European market excluding VC and venture capital, 1.86 times including them, and 4.5 times between US VC and European venture capital. It is clearest at the top of the deal distribution. It rests on public programs that go well beyond the SBIC program, and on a base of business angels with no equivalent in Europe.
What remains to be seen is what this power guarantees: capital actually invested, prices paid, returns and liquidity in proportion to its size. That is the subject of the second part of this analysis, “What dominance does not guarantee”.
Coming next. Part two, “What dominance does not guarantee”, will be published on Thursday, November 19.
Sources
- IMF, World Economic Outlook, April 2026: nominal GDP and GDP per capita, 2025.
- US Bureau of Economic Analysis, GDP, 4th Quarter and Year 2025 (Advance Estimate); Eurostat, 2025 growth released March 6, 2026 (Eunews).
- PE Research calculation from closing levels on December 31, 2015 and December 31, 2025 (S&P 500: 2,043.94 and 6,845.50; Nasdaq-100: 4,593.27 and 25,249.85; STOXX Europe 600: 365.81 and 592.19) and annual S&P 500 total returns; ECB reference rates (1.0887 and 1.1750).
- SIFMA, 2026 Capital Markets Fact Book.
- PitchBook, 2025 Annual US PE Breakdown (January 13, 2026) and 2025 Annual European PE Breakdown (January 16, 2026).
- PE Research calculation at the 2025 average exchange rate of $1.130 per euro.
- PitchBook-NVCA, Venture Monitor Q4 2025; PitchBook, 2025 Annual European Venture Report, p. 4.
- PE Research, analysis No. 2 (in French); Invest Europe, Investing in Europe: Private Equity Activity 2025 (May 7, 2026).
- Invest Europe, Transaction Value: Private Capital Analysis 2016-2025 (July 9, 2026); see PE Research, analysis No. 28 (in French).
- PitchBook, 2025 Annual US PE Breakdown; Bain & Company, Global Private Equity Report 2026.
- Crunchbase News, Largest funding rounds of 2025.
- SBA Office of Inspector General, Report 26-08, March 17, 2026; American Action Forum, The Small Business Investment Company Program: A Primer, March 9, 2021.
- SBA, SBA’s SBIC Program Delivers Record Capital in FY25, November 19, 2025.
- SBA, SBIC Program Overview (archived March 5, 2013).
- Congressional Research Service, Small Business Research Programs, December 15, 2025.
- US Treasury, State Small Business Credit Initiative.
- Intel press release of August 22, 2025, as reported by Engadget.
- Congressional Research Service, Office of Strategic Capital: Overview and Considerations, September 8, 2026.
- Invest Europe, Investing in Europe: Private Equity Activity 2025 (May 7, 2026), fundraising summary; euro amount calculated by PE Research.
- University of New Hampshire, Center for Venture Research, The Angel Market in 2024 and The Angel Market in 2023.
- EBAN, Statistics Compendium 2024.