The first part of this analysis showed that American dominance in private equity is real but varies in scale with the yardstick — from 1.6 to 4.5 times the European market —, is concentrated in the very largest deals and rests on a public and private ecosystem with no equivalent in Europe. This second part examines what that power guarantees: the concentration of managers, the capital actually invested, the prices paid, returns, liquidity, and the first nine months of 2026.
I. The power and concentration of managers
American dominance in private equity can also be measured by the power of its managers.
The large American groups have gradually built global platforms whose activities now extend well beyond corporate buyouts, into private credit, real estate, infrastructure and insurance.
To assess their weight in private equity alone, however, those other activities have to be set aside.
The PEI 300 ranking published in June 2026 provides a consistent measure of capital raised for private equity strategies over five years, from 2021 to 2025.
KKR comes first with $140.4 billion, ahead of Sweden’s EQT ($134.4 billion), Blackstone ($111.8 billion), TPG ($88.2 billion) and Thoma Bravo ($71.9 billion)1.
The world’s ten largest managers together raised $854.6 billion, close to a quarter of the $3,550 billion collected by the top 300. Eight of the ten are American; the other two, EQT and Hg, are European1.
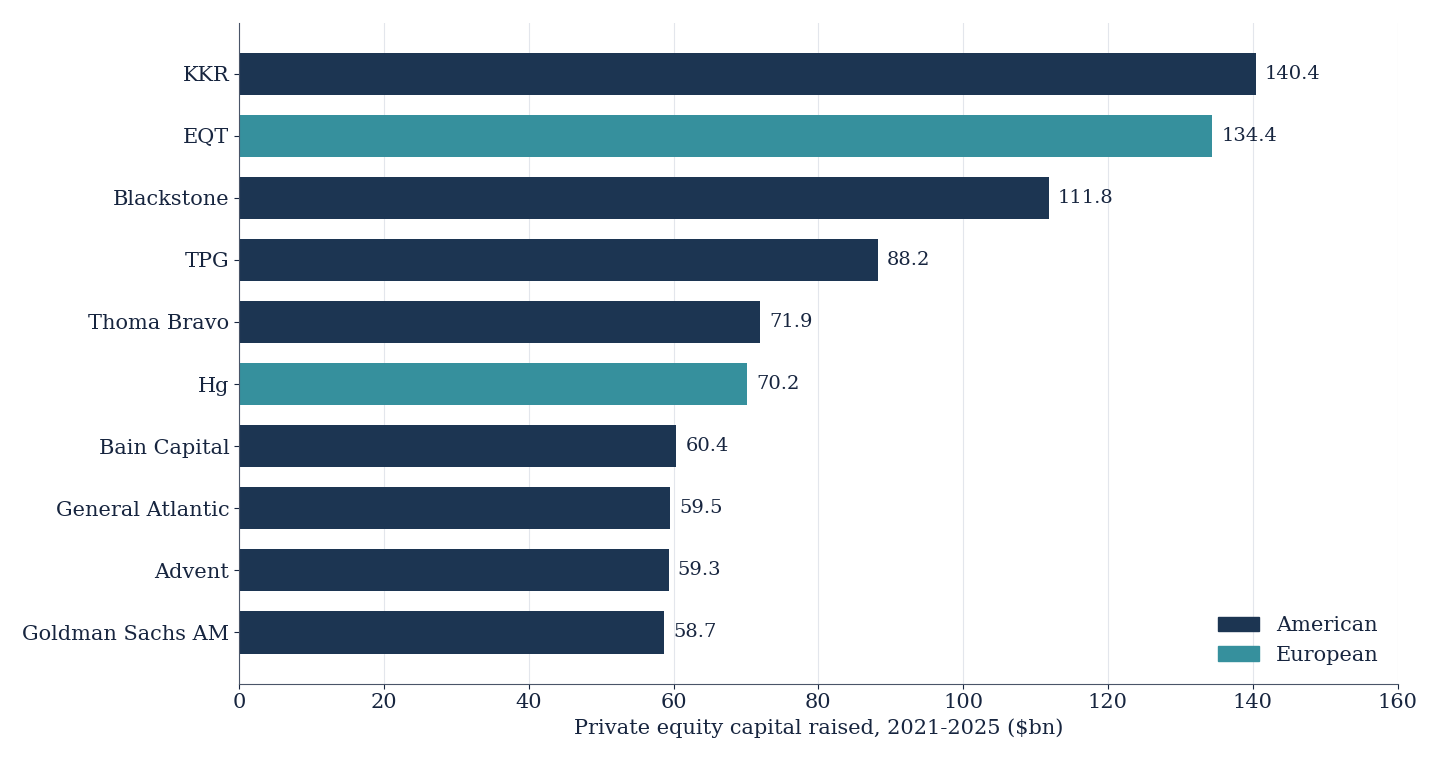
Source: PEI 300, 2026 edition: private equity capital raised over five years (2021-2025), not assets under management. The PEI scope includes some growth strategies. Total for the ten: $854.6bn.
This concentration is all the more striking because it is increasing in a general environment of slowing fundraising.
The large firms, on the strength of their track records, their fundraising teams and their institutional relationships, enjoy growing advantages over smaller managers.
EQT’s second place worldwide is nonetheless a reminder that Europe has built several platforms capable of competing with the largest American firms.
The power of managers should not, however, be confused with the geography of investment.
The large American firms deploy a growing share of their capital outside the United States, notably in Europe.
According to PitchBook, American investors took part in 19% of European deals in 2025, representing 34.8% of their total value. In the third quarter of 2026, that share reached 45.7%, a record2.
This presence is particularly strong in large acquisitions. Nine of the ten largest European deals of the third quarter of 2026 involved an American sponsor2.
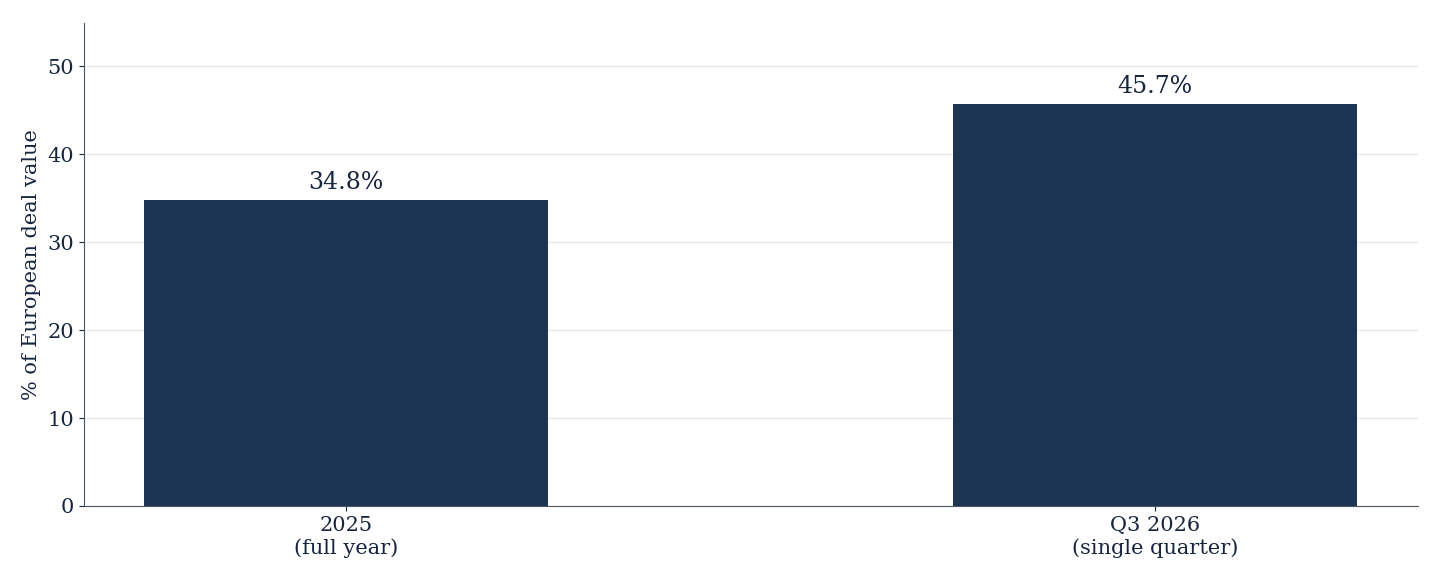
Source: PitchBook, 2025 Annual European PE Breakdown and Q3 2026 European PE Breakdown. 2025: share of annual value; Q3 2026: share of the value of that quarter alone. Not to be compared as two full years.
The European market is therefore both an investment market in its own right and a major area of expansion for American managers. Its size cannot be equated with that of the European management industry.
II. Capital invested and the changing financing of LBOs
The value of acquisitions is the indicator most often used to measure private equity activity. Yet it says little about the capital actually committed.
An acquisition financed half with debt and half with equity does not represent the same financial commitment for investors as one financed entirely with equity.
In Europe, Invest Europe records €135 billion of equity invested by funds in 2025, of which €90 billion in buyout, €23 billion in growth and €20 billion in venture capital. These investments went into 8,457 companies3.
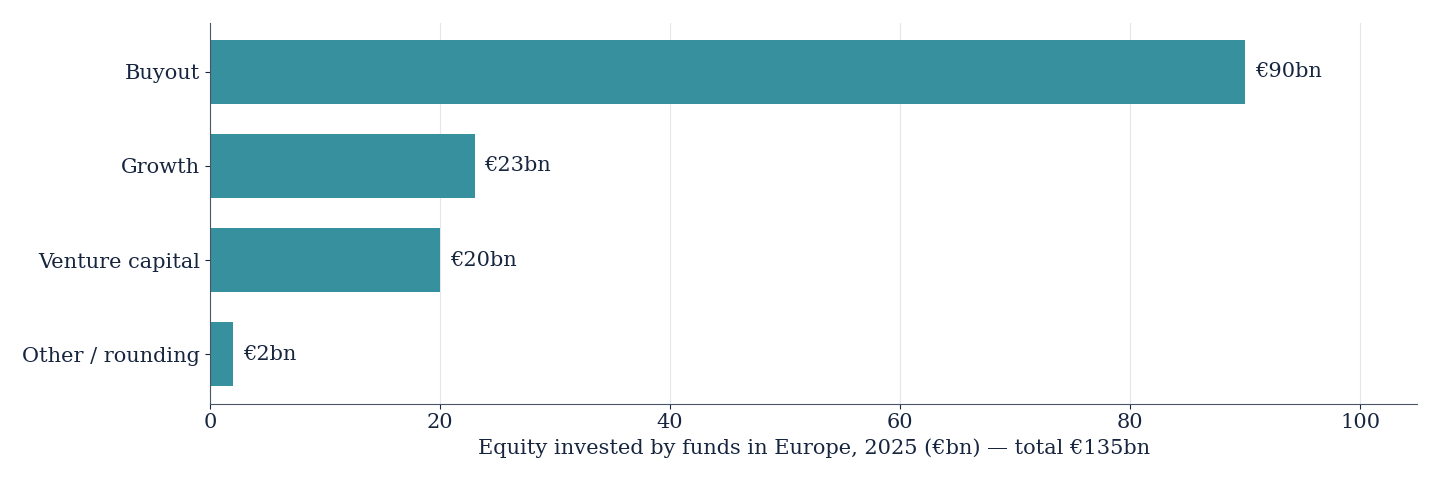
Source: Invest Europe, Investing in Europe: Private Equity Activity 2025. Total €135bn, excluding co-investors’ equity.
The measure is self-reported and does not include all the capital contributed by co-investors.
In the United States, the available statistics mainly make it possible to track how acquisitions are financed.
The PitchBook LCD series shows a significant shift: in the market for LBOs financed with syndicated loans, the equity share rose from an average of 41% over the decade before 2022 to a peak of 51% in 2023, before falling back to about 46% in 20254.
The rise in the cost of debt since 2022 has therefore gone hand in hand with a marked increase in the equity committed to large American acquisitions.
Another measure, published by StepStone, shows for 2025 a median acquisition multiple of 12.5 times EBITDA, financed with 4.7 turns of debt and 7.8 turns of equity, an equity contribution of about 62%5.
These two series cover different universes and cannot be compared directly.
In Europe, Invest Europe indicates that equity accounts on average for more than 60% of the financing of buyout transactions, but that average is calculated deal by deal and is not weighted by the total value of acquisitions6.
It would therefore be unwise to conclude from these indicators alone that European LBOs are, overall, less leveraged than American ones.
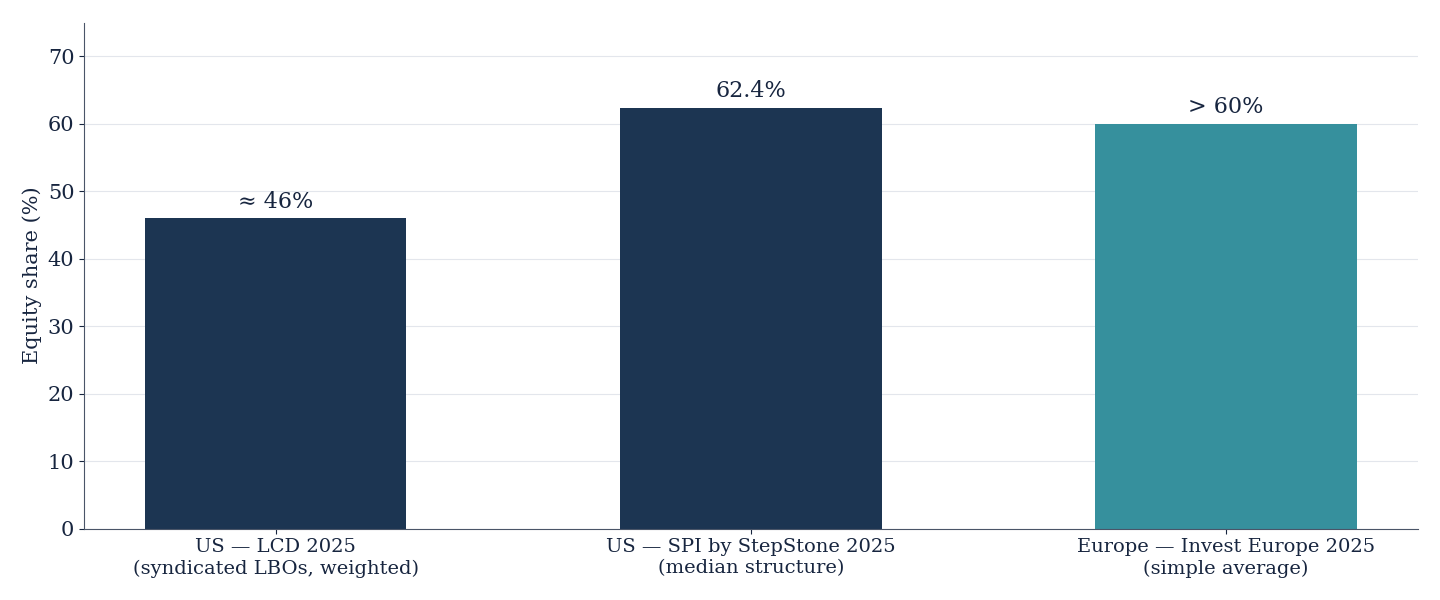
Source: PitchBook LCD (US LBOs financed in the syndicated market, 2025); SPI by StepStone via PitchBook, Q2 2026 US PE Breakdown (7.8x ÷ 12.5x); Invest Europe, Transaction Value 2016-2025 (simple average per transaction). Three universes and three methods: the ratios are not comparable with one another.
What the data show above all is a shared transformation: the use of equity has increased as credit has become more expensive, reducing the mechanical contribution of leverage to returns.
This shift comes at a time when fundraising is slowing sharply.
According to the PitchBook series, US private equity fundraising went from $377 billion in 2022, then a peak of $406 billion in 2023, to $330 billion in 2025. In Europe, it went from €152 billion in 2024 to €85 billion in 2025, in a series whose latest figures remain subject to revision7. Other providers give different orders of magnitude: analysis No. 5.2 cited, for 2024, $534 billion raised in the United States and $134 billion in Europe according to Preqin. The scope makes the number.8
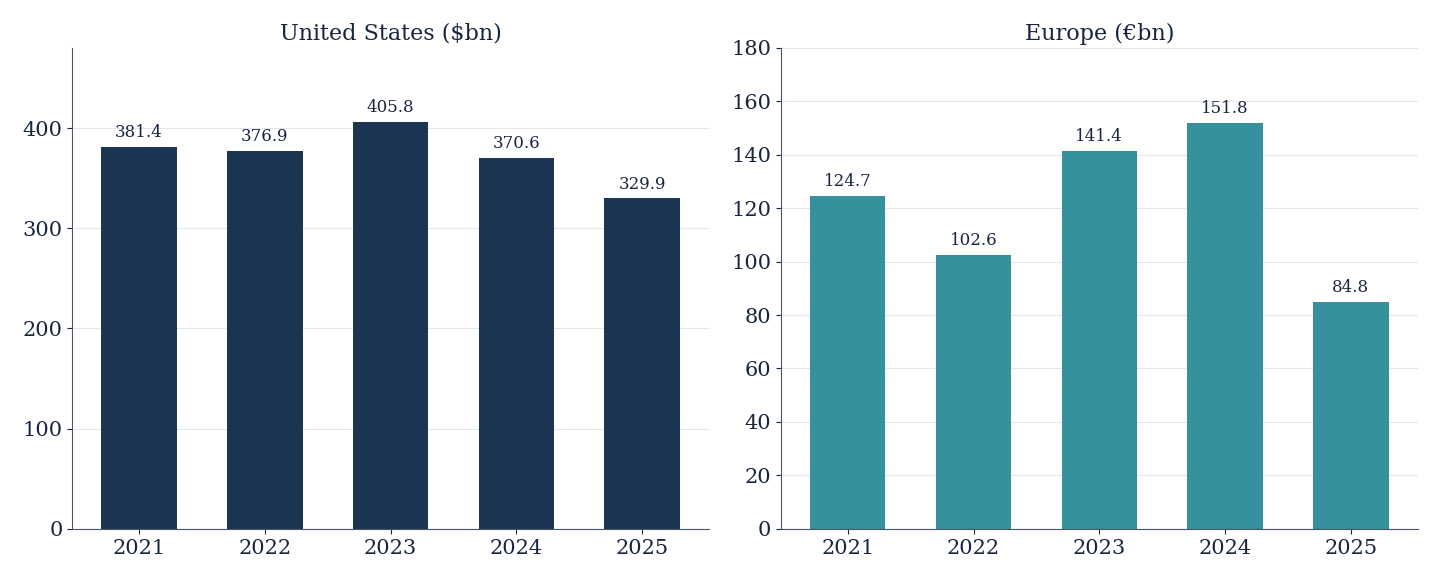
Source: PitchBook, Q3 2026 Global PE First Look (data as of September 30, 2026). Different currencies: no ratio should be drawn. Invest Europe reports €147bn of European fundraising in 2025, on a different scope.
This contraction is not only the result of less favorable financial conditions. It also reflects the growing difficulty funds have in selling their portfolio companies and distributing the proceeds to their investors.
According to Bain, global distributions amounted to only 14% of portfolio net asset value in 2025, the fourth consecutive year below the 15% threshold9.
Private equity thus faces a new constraint: its ability to raise capital now depends more heavily on its ability to return the capital already invested.
American dominance in size and financial power remains considerable. It does not, however, shield its managers from the difficulties affecting the industry worldwide.
III. Valuation and performance: less obvious gaps
The depth of the American market is also reflected in acquisition prices.
Valuation multiples are, however, an area where comparisons must be made with caution.
In 2025, the SPI by StepStone series put the median multiple of US buyout transactions at 12.5 times EBITDA5.
In Europe, the Argos Index, which tracks acquisitions of unlisted small and mid-sized companies in the eurozone, stood at 8.3 times EBITDA in the fourth quarter of 2025, before rising to 8.8 times in the second quarter of 202610.
The difference is significant, but it concerns different segments.
PitchBook’s annual European report indicates that private equity buyers paid a median multiple of 12.8 times EBITDA in Europe in 2025, against 8.9 times for corporate buyers11.
It would therefore be wrong to claim that European companies as a whole are acquired at multiples systematically lower than those paid in the United States.
The gap is easier to identify in the mid-sized company segment. PE Research showed in its analysis No. 32 that there is no single market multiple. The only source that puts a figure on an overall gap, McKinsey using StepStone data, places North America about two turns of EBITDA above Europe in 2025, without publishing its method.12
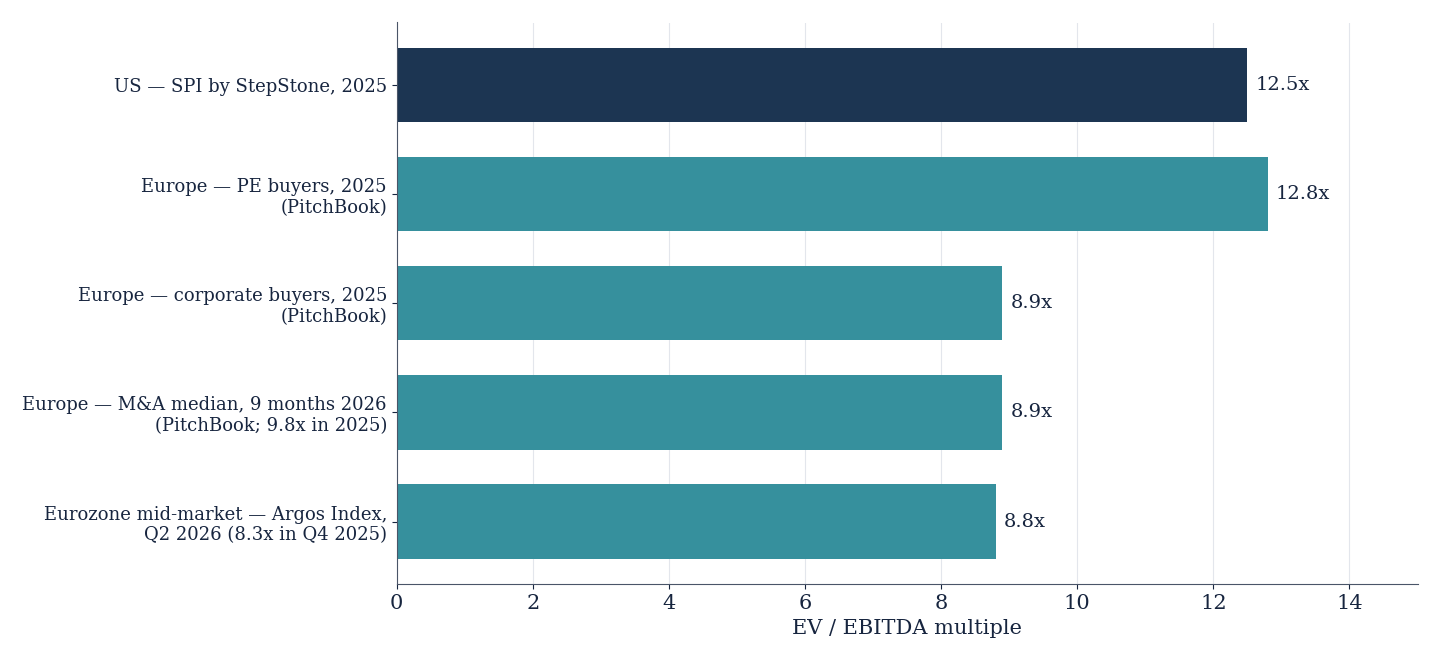
Source: SPI by StepStone via PitchBook, Q2 2026 US PE Breakdown; PitchBook, 2025 Annual European PE Breakdown, p. 13, and Q3 2026 European PE Breakdown, p. 4; Argos Index mid-market Q4 2025 and Q2 2026. Different universes: the bars do not measure the same market.
As for fund performance, it does not mechanically mirror the differences in market size.
According to Cambridge Associates data published by Invest Europe, European buyout funds show a since-inception IRR of 14.73% and a TVPI multiple of 1.6813.
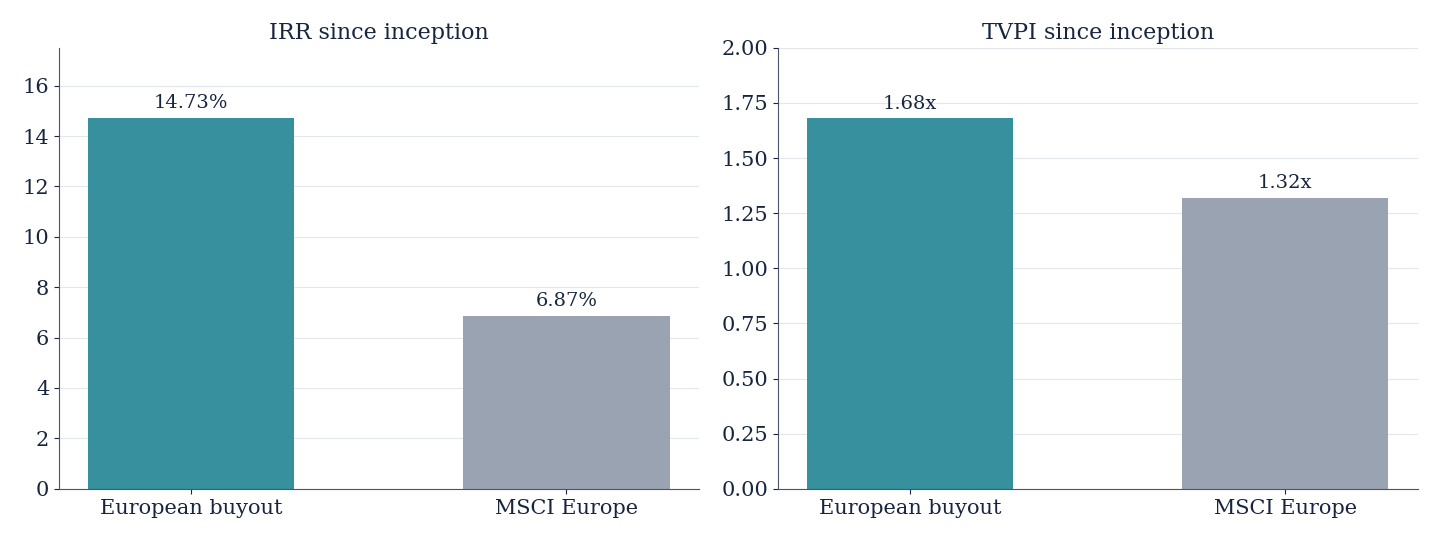
Source: Invest Europe, Performance Benchmark Report 2025, based on Cambridge Associates data.
Comparisons with North American funds vary with the time horizon. Europe performs better over some horizons, North America over others.
These results must be read in light of vintages, currencies, valuation methods and sample composition.
American dominance in investment volumes is therefore not, on its own, proof of superior returns.
IV. Liquidity, now a shared difficulty
The growth of global private equity has been accompanied by a considerable build-up of assets in fund portfolios.
According to Bain, about 32,000 companies representing $3,800 billion of unrealized value were still held by funds at the end of 20259.
The slowdown in exits has gradually turned liquidity into a major constraint for the industry.
As noted above, distributions to investors remain below 15% of portfolio net asset value; in Europe, PitchBook puts them below 20% in 2026, against a ten-year average of 27%.14
The situation affects both continents.
In Europe, sales to other funds accounted for 44% of exit value in 2025 according to Invest Europe, against 27% for sales to corporate buyers and 7% for initial public offerings15.
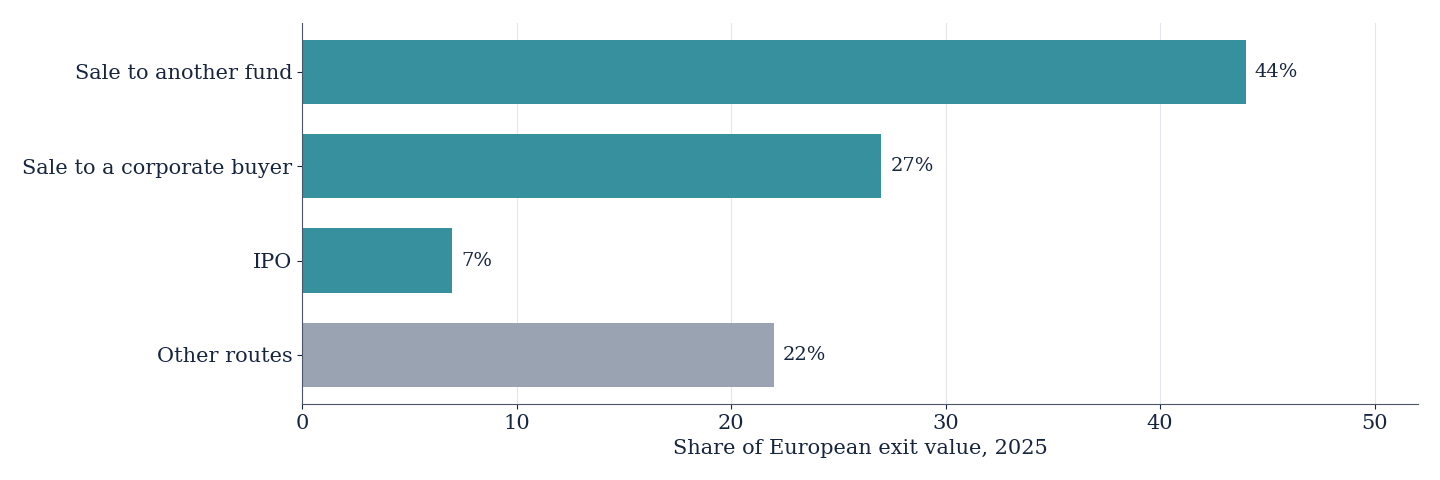
Source: Invest Europe, Investing in Europe: Private Equity Activity 2025 (share of exit value at historical cost). “Other routes”: remainder calculated to 100%.
Continuation funds have meanwhile grown strongly, with €9.9 billion invested in 2025, against €4.7 billion the year before15.
These transactions make it possible to extend the holding period of companies and to provide liquidity to some investors. They are not necessarily, however, a definitive exit from the private equity system.
The return of capital is becoming a central question for institutional investors.
On this point, Cambridge Associates data show an average time to liquidity of 3.80 years for European buyout funds, against 4.51 years for North American funds13.
This measure does not distinguish actual exits from dividend recapitalizations. It nonetheless suggests that the depth of the American market does not guarantee a faster turnover of capital.
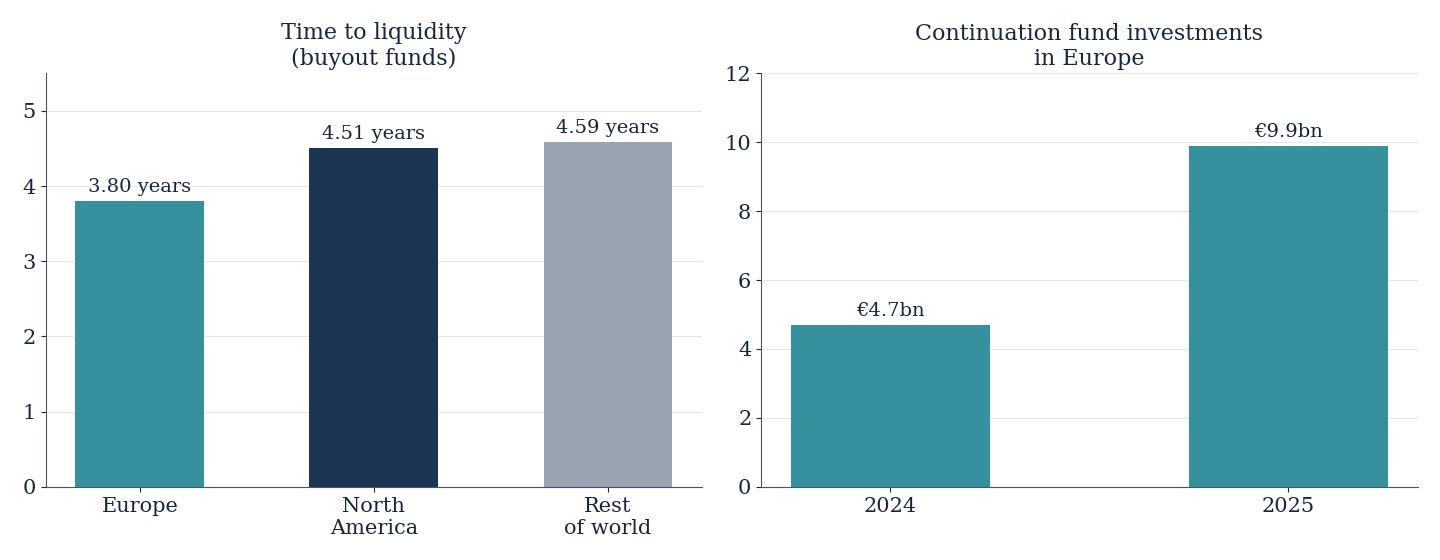
Source: Invest Europe, Performance Benchmark Report 2025, based on Cambridge Associates data; Invest Europe, Activity 2025 (continuation funds).
V. The first nine months of 2026: diverging paths
The data available at the end of September 2026 show the two markets moving in different directions.
According to PitchBook, US private equity deal value stands at $724 billion over nine months, down 14.3% from the same period of 202516.
In Europe, it reaches €465.8 billion, up 4%16.
After currency conversion, the value of American transactions exceeds that of European transactions by about 34%, against 57% for the whole of 202517.
This narrowing should not be read as a lasting reversal in the balance of power. The third quarter of 2026 in fact saw a rebound in American activity (+20%) and a decline in European activity (−10.9%)16.
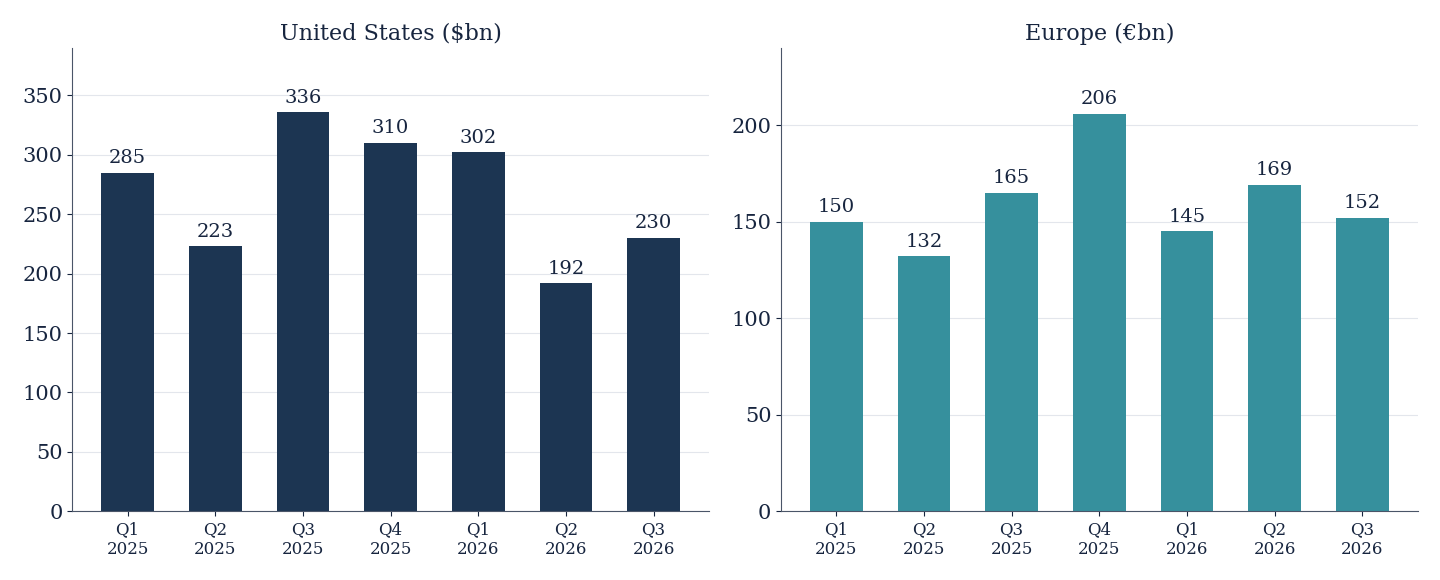
Source: PitchBook, Q3 2026 Global PE First Look (data as of September 30, 2026). Different currencies: two panels.
It does, however, reflect different cyclical dynamics.
Fundraising remains constrained on both sides of the Atlantic.
At the end of September, PitchBook counts $222 billion raised by 348 American funds, against €65.9 billion for 99 European funds18.
Capital continues to concentrate on established managers, while new entrants find it increasingly difficult to raise their first funds: in Europe, first-time fundraising falls to €1.5 billion across seven funds, the lowest in the series19.
Exits also remain insufficient to ensure a smooth renewal of institutional commitments.
Private equity thus faces a common problem: the industry’s ability to turn the valuations of its portfolios into actual distributions.
Conclusion — A structural dominance in a globalized industry
American dominance in private equity appears as the natural extension of the country’s economic and financial power.
It rests on the depth of its capital markets, the size of its companies, the investment capacity of its financial institutions and the scale of its management firms.
This dominance is particularly clear in large acquisitions and in the international reach of the leading managers.
Europe nonetheless has a considerable private equity industry, whose real weight is sometimes underestimated because of inappropriate statistical comparisons. Its market is particularly well developed in mid-sized companies and in consolidation strategies.
The comparison of performance, by contrast, does not establish a general and permanent superiority of either model.
Finally, the recent difficulties with liquidity, distributions and fundraising show that the two industries face largely common constraints.
Private equity has become a global industry, in which the large American managers invest heavily in Europe and institutional capital increasingly flows between continents.
The distinction between American and European private equity remains relevant for analyzing markets, companies and financing conditions. It is less so when it comes to measuring the power of managers whose activities now extend well beyond their home borders.
American dominance remains beyond dispute. But measuring it requires distinguishing the size of markets, the size of managers, the capital actually invested and the returns achieved.
Only on that condition does the transatlantic comparison retain real economic meaning.
Part one. 35.1. Private Equity, US vs Europe (1/2): Why America Dominates.
Sources
- Private Equity International, PEI 300, 2026 edition: capital raised over five years by the top ten managers ($854.6bn) and by the top 300 ($3,550bn).
- PitchBook, 2025 Annual European PE Breakdown, p. 5-6; Q3 2026 European PE Breakdown, p. 5.
- Invest Europe, Investing in Europe: Private Equity Activity 2025.
- PitchBook LCD: equity share in US LBOs financed in the syndicated market (41% on average over the decade before 2022, 51.1% in 2023, 46% in 2025).
- PitchBook, Q2 2026 US PE Breakdown, SPI by StepStone series as of December 31, 2025; 7.8 ÷ 12.5 = 62.4%.
- Invest Europe, Transaction Value 2016-2025, p. 8 and 33: ratio calculated deal by deal, then averaged; see PE Research, analysis No. 28.
- PitchBook, Q3 2026 Global PE First Look: US fundraising of $376.9bn (2022), $405.8bn (2023), $370.6bn (2024) and $329.9bn (2025); European fundraising of €151.8bn (2024) and €84.8bn (2025), identical figures in the Q3 2026 European PE Breakdown, p. 14.
- PE Research, analysis No. 5.2, “États-Unis vs Europe : deux modèles, sept rounds”, June 2025 (in French), based on Preqin data.
- Bain & Company, Global Private Equity Report 2026.
- Argos Index, Q4 2025 and Q2 2026, p. 4.
- PitchBook, 2025 Annual European PE Breakdown, p. 13.
- PE Research, analysis No. 32, “How Much Are Mid-Sized Companies Worth in 2026?”, October 21, 2026, citing McKinsey on StepStone data.
- Invest Europe, Performance Benchmark Report 2025, based on Cambridge Associates data.
- PitchBook, Q3 2026 European PE Breakdown, p. 11.
- Invest Europe, Investing in Europe: Private Equity Activity 2025, p. 71-73.
- PitchBook, Q3 2026 Global PE First Look; Foley & Lardner, An Early Look at Q3 2026 PE Activity, for the US quarterly change; PitchBook, Q3 2026 European PE Breakdown, p. 3.
- PE Research calculation at the average ECB exchange rate for January to August 2026 (1.163 dollars per euro).
- PitchBook, Q3 2026 Global PE First Look; Q3 2026 European PE Breakdown, p. 14.
- PitchBook, Q3 2026 European PE Breakdown, p. 15.