Ask the US data providers and you get 7.0x, 8.3x, 8.5x and 12.0x EBITDA for the same half-year. Ask in Europe and you get only three answers worthy of the name: 10.2x for private equity buyers according to Argos, 10.5x for sponsor deals according to Gain, and 8.9x for the market as a whole according to PitchBook. This analysis sets the indices side by side, continent by continent, explains what each one counts, and shows that once scope is restored, the US figures are consistent with a size premium without forming a single, homogeneous scale.
Disclosure: the author is the founder of Argos, whose index is one of the sources compared here. He took no part in collecting or calculating the 2026 data.
At a glance: what each source measures
| Source | What it measures | 2026 figure | What it tells us |
|---|---|---|---|
| United States | |||
| GF Data (ACG) | Prices paid by PE sponsors, targets of $1 million to $500 million | 7.0x (Q2) | Small targets trade at around 7x; platforms 7.6x, add-ons 6.5x (Q1) |
| Capstone Partners | Prices paid by sponsors and strategics, under $500 million | 8.3x for sponsors, 7.6x for strategics in the $10 million-$100 million bracket (H1) | At equal size, sponsors pay more than strategics |
| PitchBook | Median buyout multiple, by size bracket | 8.5x for $25 million-$100 million, 13.2x for $500 million-$1 billion (Q1) | Prices fall at the bottom of the range and rise at the top |
| Lincoln International | Value of sponsor portfolios, plus the multiple on new buyouts | 12.0x (H1); index +1.9% (Q2) | Portfolios gain value through earnings, not multiples |
| McKinsey / StepStone | Global median buyout multiple | 11.8x in 2025; 18.1x above $500 million | A global record; a 2.0-turn gap between North America and Europe |
| Europe | |||
| Argos Index | Median for control acquisitions, euro area, €15 million to €500 million | 8.8x; PE buyers 10.2x, strategics 7.9x (Q2) | The only index split by buyer type for the euro-area mid-market; a 2.3-turn PE premium |
| Gain | Median for sponsor deals in Europe | 10.5x (H1) | Near-stable year on year; a sharp drop in TMT |
| PitchBook | Median for all European M&A | 8.9x (nine months) | One turn lower than in 2025 |
| PwC | Median for German-speaking M&A | 14.9x (H1) | A highly volatile median from one half-year to the next |
| Dealsuite | Survey of 815 advisers, SMEs | 5.3x; from 3.8x to 7.2x by size (H1) | The size premium, measured within a single series |
| Lincoln International | Value of sponsor portfolios | +0.9% (Q2) | No multiple published for Europe |
I. United States: four instruments, four figures
Who measures what
| Source | Producer | What is counted | Statistic | PE buyers, 2026 |
|---|---|---|---|---|
| GF Data | ACG, the association of middle-market professionals (Chicago) | Deals reported by contributing sponsors, enterprise value of $1 million to $500 million, 85 deals in the quarter | Mean | 7.0x in Q2 |
| Capstone Partners | Investment bank (Boston) | Capital IQ and PitchBook transactions, enterprise value under $500 million, sponsors and strategics | Mean, bounded at 3x-30x | 8.3x in H1 |
| PitchBook | Data provider (Morningstar, Seattle) | Buyouts by valuation bracket | Median | 8.5x for $25 million-$100 million in Q1; 13.2x for $500 million-$1 billion in Q1 |
| Lincoln Private Market Index | Investment bank (Chicago), methodology developed with the University of Chicago | About 1,800 sponsor-backed companies with earnings under $250 million; the published multiple covers new buyouts | Mean | 12.0x in H1 |
Four producers, three families: a trade association, ACG, which collects deals reported by member funds; two investment banks with very different methods, Capstone, which reworks commercial transaction databases, and Lincoln, which revalues fund holdings on the basis of its own valuation engagements; and a data provider, PitchBook, which sells access to its database. No two define the market the same way.
Three variables that drive the figure
The first source of divergence is size. GF Data covers $1 million to $500 million, but its second-quarter sample contains no deal above $250 million; the association itself says the dip from 7.3x to 7.0x “was likely due to the mix of completed deals tracked by GF Data, rather than weakening bids.” Capstone runs from $10 million to $500 million, but 71.4% of the multiples reported for sponsors fall in the $10 million-$100 million bracket. PitchBook breaks its data down by bracket and publishes no overall median. Lincoln tracks companies with earnings of up to $250 million, a far larger universe than the other three.
The second is the buyer. GF Data and Lincoln cover only PE sponsors; Capstone also counts strategic buyers and reports both separately: 9.9x for strategics against 8.3x for sponsors across the whole range, but 7.6x against 8.3x in the $10 million-$100 million bracket where sponsors are concentrated. This reversal appears to be mainly a composition effect: strategic acquisitions are more heavily weighted toward larger companies, which generally command higher multiples.
The third is the statistic. GF Data, Capstone and Lincoln publish means; PitchBook publishes medians. In a market where a few deals close at 20x and many at 7x, the mean sits above the median, and Capstone has to bound its own between 3x and 30x to keep it readable.
There is also a difference in kind: three of the instruments measure transaction prices, that is, what a buyer actually paid. Lincoln’s index does not directly measure transaction prices: each quarter it revalues some 1,800 companies already held by funds, applying current market multiples to their latest earnings, as managers do when they mark their portfolios for investors. The index rose 1.9% in the second quarter, driven by earnings growth that more than offset a slight contraction in multiples. That is information for the investor in the funds, who wants to know what their stake is worth, not for the seller, who wants to know what they will be paid. Alongside its index, however, Lincoln publishes the average multiple on new buyouts completed by the funds it tracks, 12.0x in the first half of 2026 against 12.8x a year earlier: it is this second series, not the index, that appears in the ranking below.
Once scope is restored, a size premium
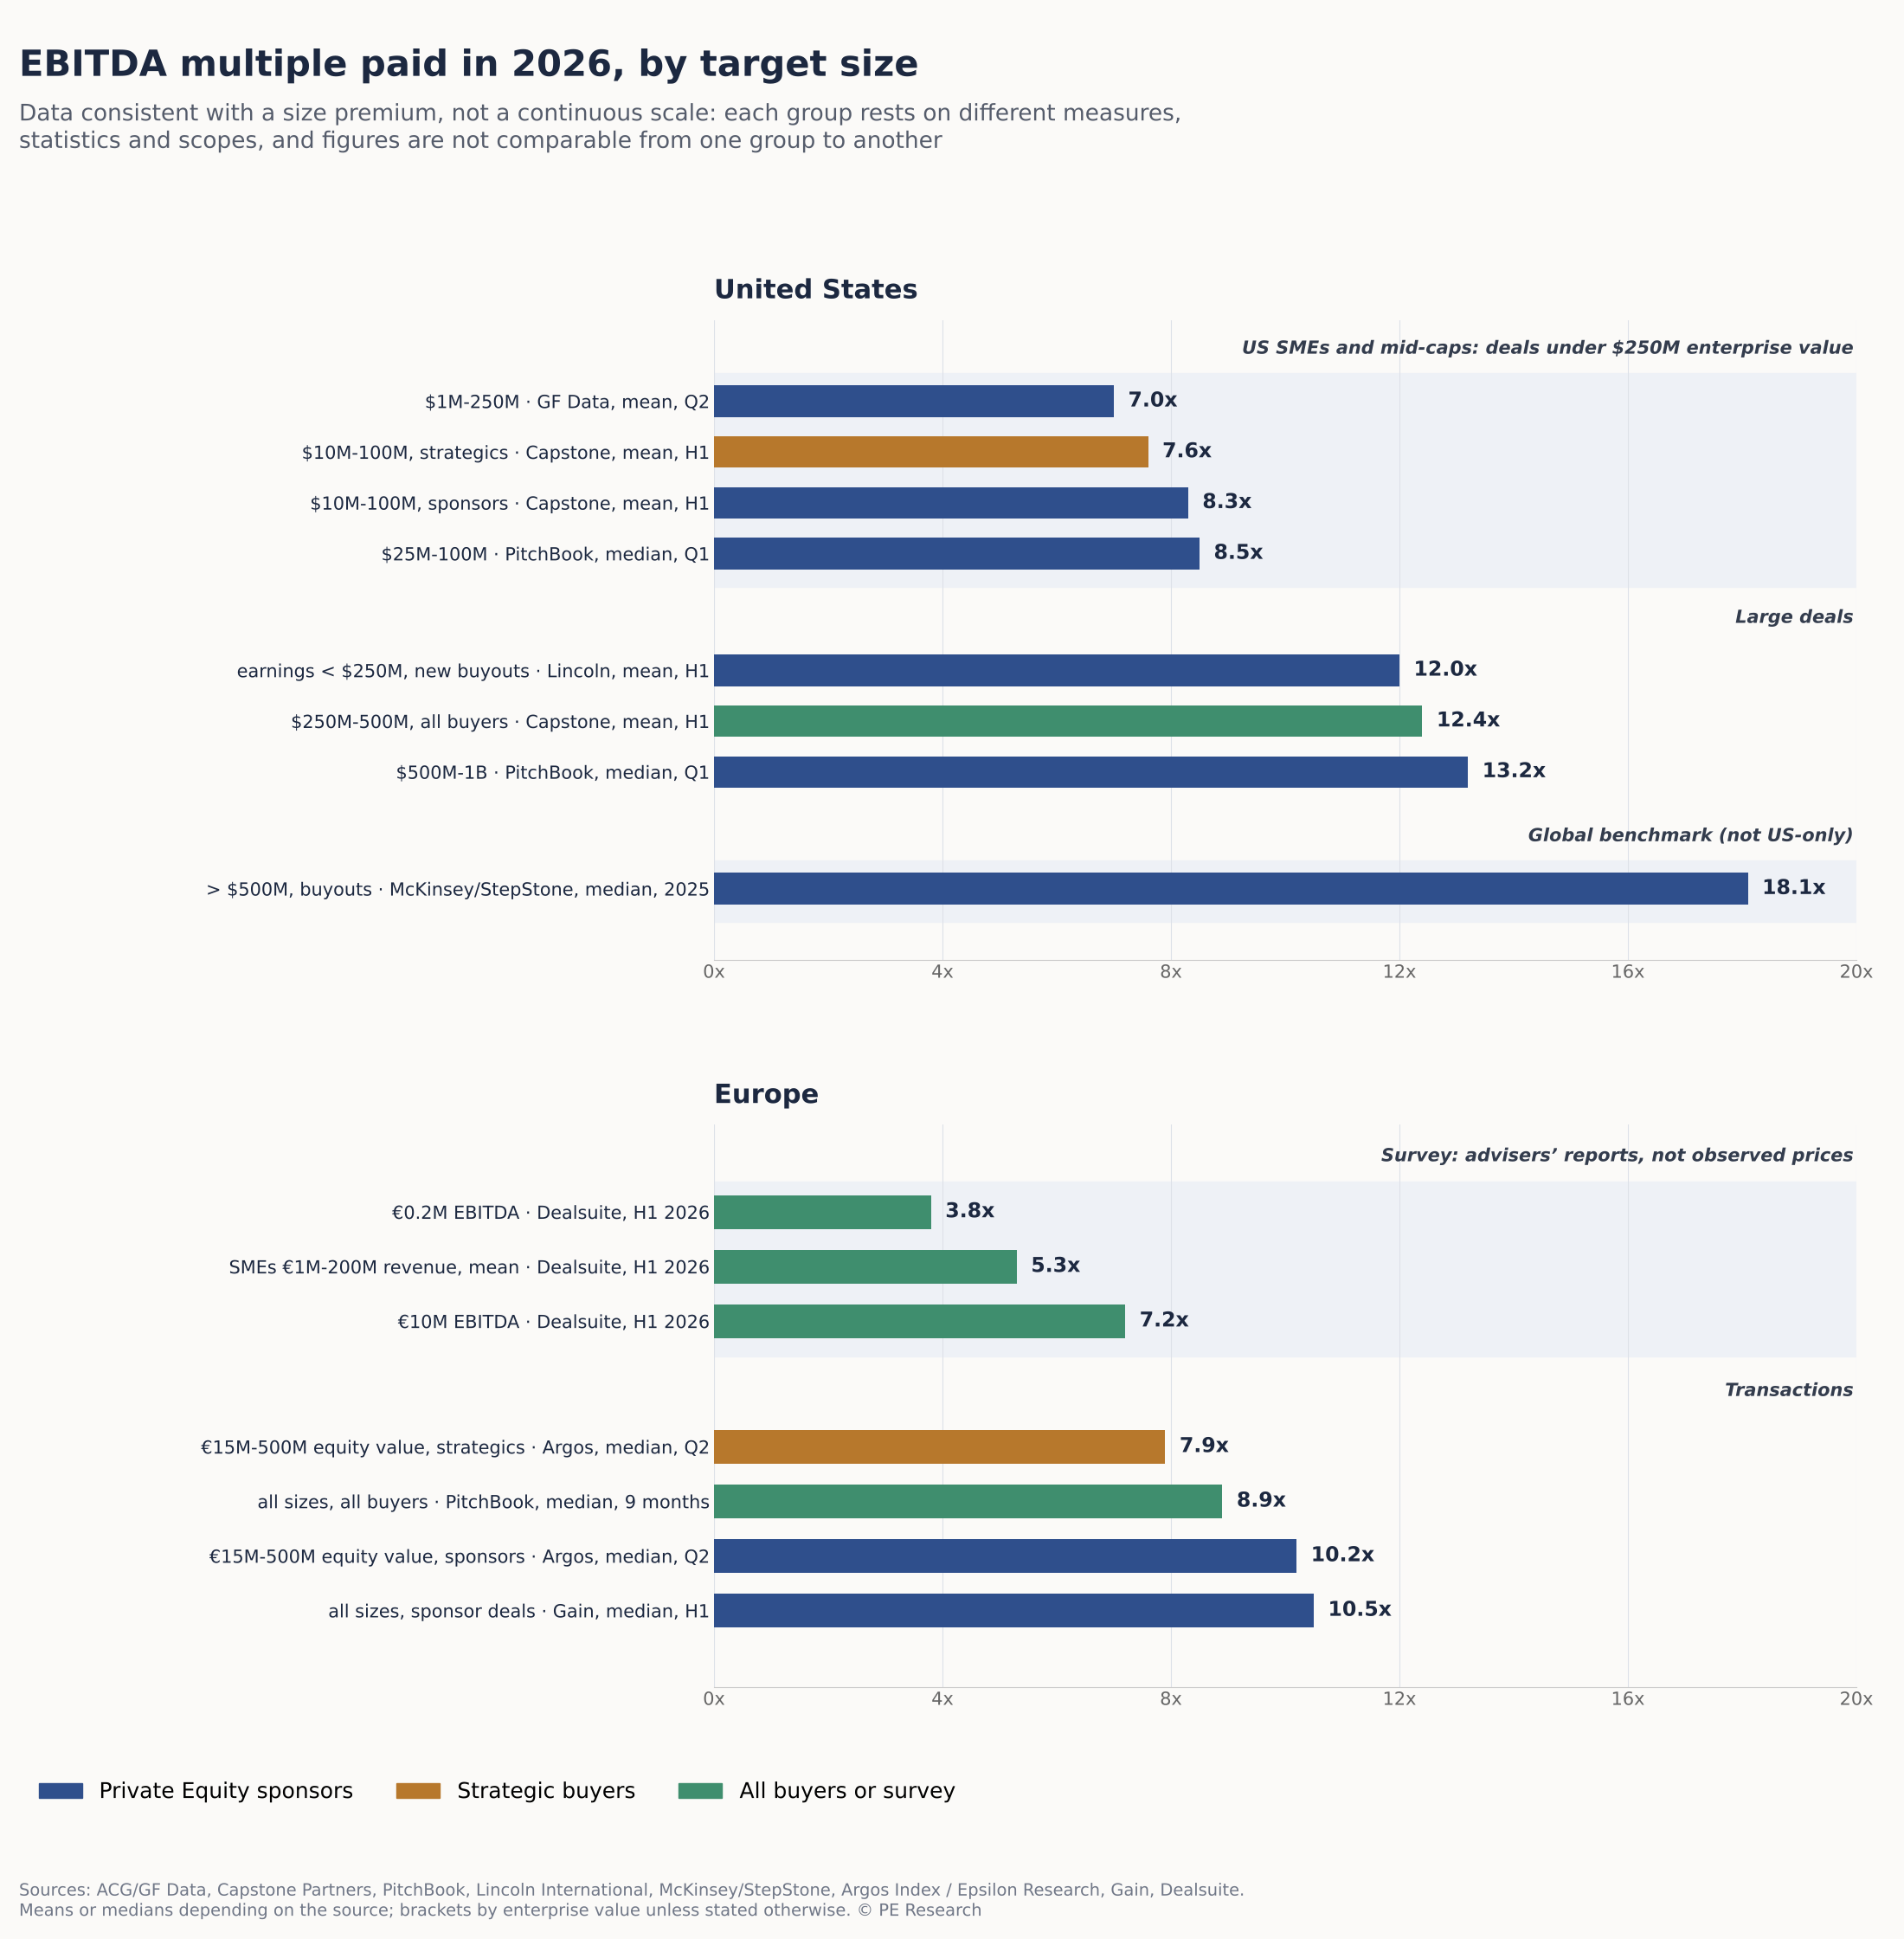
Let us rank the figures not by producer but by target size. The brackets are not uniform: GF Data, Capstone and PitchBook set them by enterprise value, Lincoln by earnings.
| Size bracket (measure depends on source) | Multiple | Source |
|---|---|---|
| $1 million-$250 million, sample weighted toward the low end | 7.0x | GF Data, Q2 2026 |
| $10 million-$100 million, strategics | 7.6x | Capstone, H1 2026 |
| $10 million-$100 million, sponsors | 8.3x | Capstone, H1 2026 |
| $25 million-$100 million, sponsors | 8.5x | PitchBook, Q1 2026 |
| Up to $250 million in earnings, sponsors | 12.0x | Lincoln, H1 2026 |
| $250 million-$500 million, all buyers | 12.4x | Capstone, H1 2026 |
| $500 million-$1 billion, sponsors | 13.2x | PitchBook, Q1 2026 |
From 7x to 13x, the figures line up with target size, whoever produces them. This ranking does not prove a single relationship, since it mixes means and medians, sponsors and strategics, and different measures of size; it shows that the four answers are consistent with a size premium, which is not the same as reconciling them. Size appears to be one of the main drivers of differences in multiples, but it cannot explain them on its own: sector, growth, profitability and asset quality also weigh.
The ranking says something else too. US sponsors have moved down market: the median size of their deals fell to $151.9 million in the first half of 2026, from $179 million in 2025, and PitchBook sums up the shift in a phrase, “lower entry multiples, but harder work.” Capstone’s 8.3x therefore reflects first and foremost a fall in prices, which PitchBook confirms on a like-for-like basis, 8.5x against 8.8x a year earlier for targets of $25 million to $100 million; sponsors’ move down market amplifies it in the mean. Meanwhile the top of the market, meaning targets above $250 million in enterprise value, is getting more expensive: 12.4x against 11.2x a year earlier at Capstone, 13.2x against 12.1x at PitchBook. The size premium is widening at both ends.
Within a single sample, other factors emerge. In the first quarter of 2026, GF Data’s contributing sponsors paid an average of 7.6x for a platform and 6.5x for an add-on, the widest gap in five years, for an overall average of 7.3x against 7.1x for full-year 2025, according to the summary published by investment bank Houlihan Capital; the gap reflects both the size and the role of the target, add-ons generally being smaller. The same report is a reminder that size does not explain everything: 8.5x in healthcare services, 7.2x in manufacturing, 7.0x in business services, 6.7x in distribution.
Above $500 million, a global source completes the picture. McKinsey’s annual private markets report, based on StepStone data, puts the median multiple paid by buyout funds at 11.8x in 2025, a record, and at 18.1x for buyouts above $500 million; over five years, the average of the medians is 15.8x for these large deals against 11.5x overall. The figure is global rather than American, but North America accounts for nearly two-thirds of the value of large buyouts.
II. Europe: three price measures, and supplements that measure something else
What is available
| Source | Producer | What is counted | Statistic | 2026 value |
|---|---|---|---|---|
| Argos Index | Argos and Epsilon Research (Paris) | Control acquisitions of euro-area companies, equity value of €15 million to €500 million, PE buyers and strategics, excluding financials, real estate and high tech; about a quarter of eligible deals analyzed one by one | Six-month rolling median | 8.8x; PE buyers 10.2x, strategics 7.9x in Q2 |
| PitchBook, European PE Breakdown | Data provider (Morningstar) | All M&A in Europe, UK included, all sizes, sponsors and strategics | Median | 8.9x for the first nine months of 2026, against 9.8x in 2025; a sponsor premium over strategics noted but not quantified |
| Gain, State of European Private Equity | Private markets data platform (Amsterdam, London, New York) | Sponsor entries and exits in Europe, majority and minority, excluding venture capital and financial services, companies documented through primary research | Median | 10.5x in H1 2026, against 10.7x in 2025 and 13.6x in 2021; platforms 10.7x, add-ons 10.0x |
| PwC, M&A deal insights DACH | Audit and advisory firm | All M&A in Germany, Austria and Switzerland, all sizes, sponsors and strategics | Median | 14.9x in H1 2026, against 9.5x in H2 2025 and 7.3x a year earlier |
| Dealsuite M&A Monitor | Dutch M&A matchmaking platform | Survey of 815 advisory firms, SMEs with €1 million to €200 million in revenue, Europe by region | Mean reported by advisers | 5.3x in H1 2026; from 3.8x at €0.2 million EBITDA to 7.2x at €10 million |
| European Lincoln Private Market Index | Lincoln International | More than 450 sponsor-backed European companies, median EBITDA of about €37 million; euro-area and UK sub-indices | Change in portfolio value | +0.9% in Q2 in local currency; no multiple published |
The contrast with the United States is striking. America has four measures of transaction prices, one of them drawn from the entry deals observed by Lincoln, with different scopes that can nonetheless be laid over one another. Europe has three, and they do not overlap.
Argos Index. It measures a median multiple for control acquisitions of small and mid-sized companies in the euro area valued between €15 million and €500 million, broken down for PE buyers and for strategic buyers. Launched at the end of 2006 and published every quarter since, nearly eighty editions in all, it has become the benchmark index for European private markets: picked up by the specialist press with every release, from CFNEWS to Private Equity International, used by practitioners to date a cycle or value a portfolio, and praised by academics such as Reiner Braun of the Technical University of Munich for the robustness of its methodology.
PitchBook. It gives a median for the whole European market, UK included, with no size brackets and no published split between sponsors and strategics: 8.9x for the first nine months of 2026, against 9.8x in 2025, a lost turn that PitchBook attributes to the ECB’s two rate hikes, in June and September, and describes as a headwind for those selling assets bought at 2021-2022 prices and a tailwind for those buying today.
Gain. A private markets data platform, Gain measures the median for sponsor deals only, entries and exits combined, minority stakes included, which makes it a measure of the private equity segment rather than of acquisition prices alone: 10.5x in the first half of 2026, against 10.7x in 2025, 23% below the 2021 peak; the cheapest quartile trades below 7.8x, the most expensive above 14.0x, and TMT, at 12.5x, has lost four turns in a year while other sectors hold at 10.1x.
The other instruments are of a different nature: Dealsuite does not measure transactions but what advisers say they have observed, on much smaller companies, and Lincoln measures the value of existing portfolios without publishing a multiple for Europe. Clearwater’s Multiples Heatmap, which used to provide European sector multiples, has had no edition identified in 2026.
Nor do the three measures move in the same direction. Argos is rising, from 8.3x at the end of 2025 to 8.8x in the second quarter, and to 10.2x for PE buyers; Gain is nearly flat, from 10.7x to 10.5x; PitchBook is falling, from 9.8x to 8.9x. Argos and Gain cover the same period, through the end of June, so their gap comes down to scope: the euro-area mid-market and control deals only at Argos; all sizes, minority stakes and exits included at Gain. PitchBook measures the entire European market, UK included, over nine months, and the third quarter, which followed the ECB’s first hike, weighs in its median. On levels, however, the two sponsor-only measures come close: 10.2x at Argos, 10.5x at Gain, an indicative convergence between two statistics built differently.
PwC’s median for the German-speaking countries illustrates, conversely, how fragile an aggregate statistic can be: 14.9x in the first half of 2026, against 9.5x six months earlier and 7.3x a year earlier, in a series that has swung between 6.5x and 18.1x since 2021. PwC attributes this to a shift in activity toward large strategic assets; the half-year saw 36 deals above €1 billion, a record, and the top ten accounted for 53% of value. A change in the composition of the sample is a credible hypothesis, but concentration of value does not mechanically explain the movement of a median multiple: one would need the distribution of multiples and the number of deals with usable EBITDA. PwC publishes neither, and notes that only 22% of the half-year’s deals have a disclosed value.
What these instruments say nonetheless
Put together, they provide benchmarks for the lower and middle tiers of the European market. Dealsuite, in its September 2026 edition, puts very small companies, with €200,000 of EBITDA, at 3.8x, then 4.9x at €1 million, 6.2x at €5 million and 7.2x at €10 million. This progression, measured within a single survey and with a single measure of size, is the strongest argument for the size premium, stronger than juxtaposing different providers; it rests, however, on what advisers report rather than on contractual prices. Regional differences are narrow, 0.4 turns, from 5.0x in the Netherlands to 5.4x in the German-speaking countries; France stands at 5.3x. Argos takes over from there: 7.9x for strategics in the €15 million-€500 million equity value bracket, 10.2x for PE buyers, with the quarter’s rebound driven by the €150 million-€500 million segment. As in the United States, the figures are consistent with a size premium. Here again the brackets are not uniform: Dealsuite ranks by EBITDA or by revenue, Argos by equity value, and Gain and PitchBook do not rank by size at all.
| Size bracket (measure depends on source) | Multiple | Source |
|---|---|---|
| €0.2 million EBITDA | 3.8x | Dealsuite, H1 2026 survey |
| SMEs with €1 million-€200 million in revenue, mean | 5.3x | Dealsuite, H1 2026 survey |
| €10 million EBITDA | 7.2x | Dealsuite, H1 2026 survey |
| €15 million-€500 million equity value, strategics | 7.9x | Argos, Q2 2026 |
| All sizes, all buyers, Europe as a whole | 8.9x | PitchBook, nine months 2026 |
| €15 million-€500 million equity value, PE buyers | 10.2x | Argos, Q2 2026 |
| All sizes, sponsor deals, Europe as a whole | 10.5x | Gain, H1 2026 |
Above €500 million, Europe has no measure by bracket. PitchBook’s median includes these deals without isolating them: this is the main gap in the European data, precisely where the most talked-about deals happen.
III. What the comparison allows, and what it rules out
It allows strategic buyers to be compared: 7.6x in the lower US bracket, 7.9x in the euro area. The two figures are a third of a turn apart, but the populations are not equivalent: a mean for the $10 million-$100 million enterprise value bracket on one side, a median for €15 million-€500 million in equity value on the other; the brackets, sectors and statistics differ too much to conclude that prices are equal. In Europe, the median multiple for strategics held nearly steady, from 7.8x to 7.9x, while the Euro Stoxx TMI Small gained 7.9% over the quarter.
It does not, on the other hand, allow the premium paid by PE buyers to be compared directly. Capstone measures 0.7 turns in the United States, as a mean, in the $10 million-$100 million bracket; Argos measures 2.3 turns in the euro area, as a median, in the €15 million-€500 million equity value bracket. These are two independent observations, on different populations and with different methods: they do not support the conclusion that European funds structurally pay a higher premium. Argos offers an explanation for its own figure, which Capstone does not quantify: 58% of PE deals in the first half of 2026 were in high-multiple sectors (software, healthcare, information technology, B2B services), against 35% for strategics. Going further would require controlling for size and sector, which none of the sources allows.
Nor does it allow the gap in levels between the two continents to be quantified. The only source that ventures an estimate, McKinsey based on StepStone, puts it at 2.0 turns in North America’s favor in 2025, against 1.0 turn a year earlier, without publishing the details of its calculation; according to the report, several funds see it as an opportunity to buy European assets more cheaply and reposition them toward the US market.
One limitation is common to all these sources: EBITDA itself. A multiple of 8x adjusted EBITDA is not comparable to 8x reported EBITDA. Adjustments for one-off items, the application of IFRS 16, which removes lease payments from operating expenses and therefore increases EBITDA, and the choice between historical and forecast EBITDA can change a multiple significantly. The sources do not align on this point: GF Data relates enterprise value to trailing twelve-month adjusted EBITDA, Argos to historical EBITDA restated by Epsilon Research, Gain to historical EBITDA, Dealsuite to normalized EBITDA; the others do not state their convention in the documents reviewed. Part of the differences between sources may come down to this difference in denominator alone.
IV. Twenty-five years of North American buyouts: entry price, leverage and returns
The multiples observed in 2026 offer a snapshot of the market. A CEPRES study, published in June 2026 by Ben Ferguson and covering 20,718 North American buyouts since 2000, puts these valuations in a long-term perspective.
The change is particularly marked in software: across a sample of 2,897 North American buyouts, the median entry multiple (enterprise value/EBITDA) rose from 8.1x in 2000-2004 to 20.4x in 2020-2025, a 2.5-fold increase.
Across all North American buyouts, the study shows an association between purchase price and returns: deals struck between 3x and 6x EBITDA, which account for 11% of deals, show a pooled gross IRR (computed on the aggregated cash flows of all deals, before fees and carried interest) of 52.3%, against about 20% for the 88% of deals struck above 6x. This comparison does not control for sectors, vintages or risk profiles.
On financing, deals with a total debt-to-EBITDA ratio between 4x and 6x record the highest median IRR. Over the same period, the share of acquisitions financed at more than 8x EBITDA rose from 4.0% in 2000-2004 to 15.2% in 2020-2025.
These historical data, which cover all deal sizes, are not directly comparable with the 2026 multiples presented in this article by size segment. They come from a proprietary CEPRES database and have not been independently corroborated for the purposes of this analysis.
Key takeaways
There is no such thing as “the market multiple,” only multiples by size bracket, sector, buyer type and statistic. In the United States, four instruments appear to contradict each other; ranked by size, from 7x to 13x, they are consistent with a size premium without forming a homogeneous scale. In Europe, three instruments measure transaction prices, one split by buyer type for the euro-area mid-market, the other two in aggregate for Europe as a whole, and none isolates the top of the market.
For a business owner considering a sale, the lesson is simple: the multiple they are quoted depends on their size, their sector, and the interest that strategic buyers and funds may or may not have in them. Dealsuite underlines what is at stake: in half of all processes, advisers consider the seller’s expectations too high, by 25% on average, and 29% of these gaps cause the deal to fail.
Key concepts
EBITDA multiple. The ratio of a company’s enterprise value, that is, its equity value plus net debt, subject to the adjustments specific to each transaction, to its earnings before interest, taxes, depreciation and amortization. It is the unit of account for the price of private acquisitions because it depends neither on the target’s capital structure nor on accounting rules for depreciation.
Mean and median. The mean adds up all the multiples and divides by their number; it is pulled up by a few extreme values. The median is the value that splits the sample into two halves; it is much less sensitive to them.
Enterprise value and equity value. Enterprise value includes net debt; equity value excludes it. Capstone, GF Data and PitchBook set their sample bounds by enterprise value; Argos by equity value. For the same company, the latter is lower than the former by the amount of its net debt.
Transaction multiple, adviser survey, portfolio index. The first measures the price actually paid in an acquisition, based on documents. The second, like the Dealsuite M&A Monitor, aggregates what intermediaries say they have observed. The third, like the Lincoln Private Market Index, tracks changes in the estimated value of companies already held by funds. Only the first is a price.
Middle market, mid-market. Both terms refer to mid-sized companies, but each producer sets its own bounds: $1 million to $500 million at GF Data, under $500 million at Capstone, €15 million to €500 million at Argos, €1 million to €200 million in revenue at Dealsuite, earnings under $250 million at Lincoln. The European medians from PitchBook and Gain, PwC’s median for the German-speaking countries and McKinsey’s global median have no bounds: they cover the entire market within their scope.
Periods covered
GF Data: Q2 2026, published by ACG on August 27, 2026. Capstone Partners: H1 and Q2 2026, published in October 2026. PitchBook: Q1 2026 multiples and H1 2026 median deal size, article of September 14, 2026. Lincoln Private Market Index: Q2 2026 for the index, H1 2026 for the multiple on new buyouts, published August 12, 2026; European index published September 9, 2026. Argos Index: Q2 2026, six-month rolling median, published September 3, 2026. PitchBook, European PE Breakdown: first nine months of 2026, data as of September 30, 2026. Dealsuite M&A Monitor: H1 2026, September 2026 edition. GF Data via Houlihan Capital: Q1 2026. McKinsey, Global Private Markets Report 2026: full-year 2025, StepStone data as of September 30, 2025, published February 2026. Gain, State of European Private Equity H2 2026: data as of June 30, 2026. PwC, M&A deal insights DACH: H1 2026, published September 2026.
Sources
- ACG, GF Data Reports Show Steady Middle-Market Deal Flow Amid More Selective Financing Conditions in Q2, August 27, 2026.
- Capstone Partners, Capital Markets Update, Middle Market M&A, Q2 2026, October 2026, based on Capital IQ and PitchBook.
- CEPRES, Ben Ferguson, Private Markets: What’s Changed and What Hasn’t: 25 Years of Pricing, Leverage, and Returns in the Spotlight, June 2026.
- PitchBook, a Morningstar company, Middle-market PE firms move down market in search of value, Madeline Shi, September 14, 2026.
- Lincoln International, The Lincoln Private Market Index: Earnings Growth Drove a Q2 Rebound, August 12, 2026.
- Lincoln International, Q2 2026 European Lincoln Private Market Index, September 9, 2026.
- Argos and Epsilon Research, Argos Index mid-market, Q2 2026, September 3, 2026; full report (PDF, in French).
- PitchBook, a Morningstar company, Q3 2026 European PE Breakdown, Nicolas Moura, data as of September 30, 2026, subscriber-only report.
- Dealsuite, European M&A Monitor, 8th edition, September 2026.
- Houlihan Capital, M&A Update, U.S. Micro Middle Market, Q1 2026, based on GF Data, no online version.
- McKinsey & Company, Global Private Markets Report 2026 — Private equity: Clearer view, tougher terrain, February 2026, based on SPI by StepStone.
- Gain, The State of European Private Equity Report, H2 2026, data as of June 30, 2026.
- PwC, M&A deal insights DACH, H1 2021–H1 2026, September 2026, based on Unquote, Refinitiv and Mergermarket, no online version.