America is the land of the number and the league table. It ranks everything: companies since the Fortune 500, fortunes since the Forbes 400, universities, and baseball players, whose every move has been measured for a century and a half. In an industry where performance makes fortunes, venture capital was never going to escape the rule: for twenty-five years, Forbes has named the hundred best investors in the world each year. But these rankings sometimes rest on obscure methods. Two recent studies from Stanford and Ohio State measure what this one is worth and what it produces: the list can only be reconstructed two-thirds of the way from public data, but appearing on it opens the door to the best startups.
“We study human capital in venture capital (VC) using a new dataset covering over 100,000 professionals affiliated with U.S. VC firms. Investment success is extremely concentrated: fewer than 40% of VCs with any investments are ever credited with a successful investment, and 90% of investment profits are generated by 5% of VCs. Differences in education, prior work experience, and demographics predict career progression and investment outcomes, consistent with persistent investor-specific skills. Quasi-experimental variation from marginal inclusions on the Forbes Midas List shows that achieving superstar status increases access to highly-valued startups, complementing other human capital and contributing to concentration.”
Abstract of the NBER study by Blake Jackson (Ohio State University) and Ilya A. Strebulaev (Stanford GSB), July 2026.
Venture capital, the segment of Private Equity devoted to young companies, carries real weight in the American economy: the companies it has financed account for 41% of total U.S. market capitalization and 62% of public U.S. companies’ R&D spending (Gornall and Strebulaev, 2021), and seven of the ten largest companies by market capitalization as of December 2025 were primarily backed by venture funds early in their lives. It is also a business of individuals. The academic literature has established as much: the identity of the partner who sits on a startup’s board explains its future better than the name of the firm he or she represents. Little wonder, then, that an individual ranking has come to occupy a place in this industry that no league table of fund managers holds anywhere else. That ranking is the Midas List, several of whose historic figures populate our Hall of Fame of venture capital (analysis no. 15, in French). Blake Jackson (Ohio State University) and Ilya Strebulaev (Stanford Graduate School of Business) devote part of two 2026 papers to it: a National Bureau of Economic Research working paper on investors’ human capital, “Human Capital in Venture Capital” (July 2026), and a preliminary paper, “Ranking Venture Investors” (June 2026), which proposes a competing ranking. Neither has yet been peer reviewed; the second describes itself as a version circulated for discussion. The figures below should be read with that caveat.
A ranking built on submissions
The Midas List has been published by the American magazine Forbes since 2001, every year except 2010. The name refers, of course, to the king of myth who turned what he touched into gold. For the past fifteen years or so the calculation has been carried out by TrueBridge Capital Partners, a fund-of-funds manager. The method, as Forbes describes it, counts for each investor the portfolio companies that, over the previous five years, went public or were acquired for at least $200 million, or whose private valuation at least doubled since the initial investment to reach $400 million. Realized exits weigh more than unrealized gains, though the weighting is not published, the authors estimating that a factor of two best reproduces the list, and the most involved investors, through a board seat or by leading a round, receive more points. The data come from public sources and from the “submissions of hundreds of investment partners across dozens of firms” each year, through a form that includes a free-text field describing, qualitatively, the partner’s role in a company’s success. The data cut-off date is not stated: the FAQ asks for data as of December 31 “if possible,” the submission window closes at the end of January, and the 2023 list appeared on May 4. The exact scoring has never been made public. The authors report that their requests for information from Forbes and TrueBridge went unanswered.
Between 2001 and 2025, the list recorded 2,175 entries for 559 people, of whom 399 are American venture capital or growth equity investors; the others are based outside the United States (84 people) or come from other professions (76) — bankers, angel investors, lawyers, executives — admitted in the early years under a looser definition. Measured against all American investors credited with at least one deal, these honorees represent 2.4% of individuals and 5.5% of investments. One in four investors with at least six successful deals to their name has appeared at least once. The list is also overwhelmingly American: according to the ranking data published by Forbes, only two French nationals have appeared since 2013, both working in London and New York, and both only since 2021 and 2022.
These honorees stand out against a profession the same dataset portrays. Of the roughly 37,000 investment professionals identified at American venture firms, 69.7% are white and 23% are women (on the latter point, see our analysis no. 15.2, in French). One in six (16.4%) did their undergraduate studies at an Ivy League university, nearly one-third hold an MBA and one in ten a doctorate or equivalent. About a quarter worked at a startup, and 7.5% led or founded a startup that succeeded. Over the years the profession has included proportionally more women, fewer science and engineering graduates and more business graduates, while the share with startup experience has stayed roughly stable.
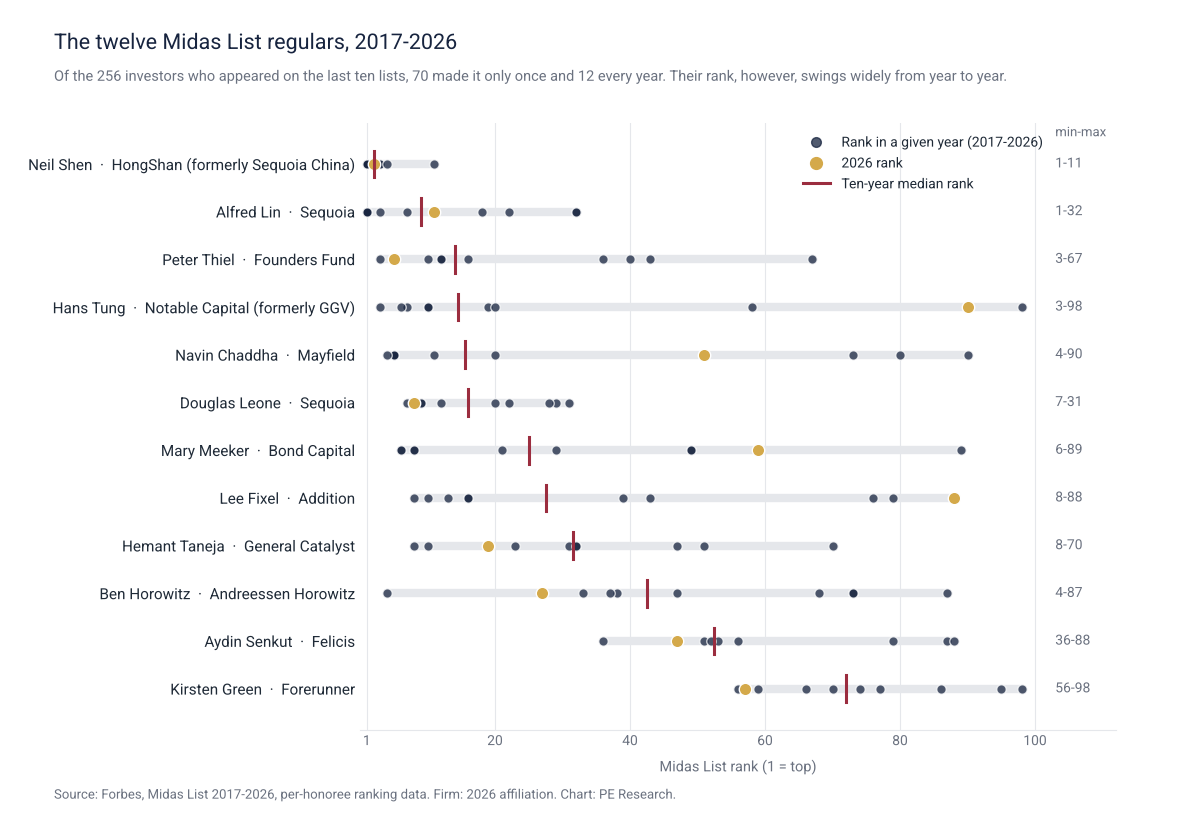
The list also turns over a great deal. Across the last ten editions, 256 investors appeared at least once: 70 only once, and just 12 every year. Even these twelve regulars are not ranked consistently: apart from the first among them, who never fell below eleventh place, all have swung by 25 to 95 places from one year to the next, and three of them have been ranked both in the top ten and below ninetieth.
A list that can only be reconstructed two-thirds of the way
Both papers attempt to reproduce the list from available data. For this the authors draw on the largest database ever assembled on American venture capital, rebuilt from the archived websites of management firms, from PitchBook, VentureSource and IPO filings. Their final sample counts a little more than 103,000 distinct individuals affiliated with U.S.-headquartered venture firms, many of whom appear only in the archived web pages; by way of comparison, PitchBook covers about 36,000 of them and VentureSource about 15,000. Their replication awards each company one point per dollar of valuation, split among its investors with a premium for investing early, taking a board seat and leading a round, counting only companies exited above $200 million or valued above $400 million, and treating one dollar of realized exit as worth two dollars of private valuation, the coefficient that fits best. The authors also varied the weightings systematically to keep those that best match the actual list, year after year.
The result is partial. Across all years, about 60% of the American investors actually listed appear in the top hundred of the replication. The reconstruction works well at the top: those predicted in the top five appear on the real list 71% of the time, and an investor ranked between first and tenth by Forbes has a 75% chance of being in the replication’s top hundred. It degrades at the bottom: investors ranked 51 to 100 by the replication appear on the real list only 33% of the time, and those Forbes ranks 91 to 100 are found in the reconstructed top 100 in only 31% of cases. For 2023, examined in detail, 51 of the 76 Americans on the real list appear in the top 100 of the best replication, or 67%; but for those 51 shared names, the correlation between their Forbes rank and their replication rank is only 0.15, on a scale where 1 would mean identical rankings and 0 no relationship at all. Conversely, 49 investors in the reconstructed top 100 are absent from the 2023 list, 15 of them among the top 30. The authors note that several of them have more IPOs to their name, over the five-year window, than nearly all the investors who were included, and that one would have to credit them with an “implausibly small” role in those exits to justify their absence. Several do appear on the list in other years.
Three explanations are ruled out one by one: the difference in method, since the replication follows that of Forbes; the gap in cut-off dates, a few weeks to four months at most; and the difference in data, given that the most glaring cases rest on IPOs amply documented in commercial databases. Three conjectures remain, which the authors present as such: a preponderant weight given to the investors who submit their own data, a source of selection bias; undeclared manual adjustments, which would then be “more than sporadic”; or a component of the method, qualitative or quantitative, that the list’s producers choose not to publish.
Another method, another list
The June 2026 paper goes further by proposing an alternative ranking built on six factors the authors consider economically more relevant. Valuation first, applying to still-private companies a 32.4% discount to the latest post-money valuation, since the preferred shares issued in funding rounds are worth more than common stock and the headline valuation overstates implied market capitalization by nearly 50% on average for unicorns. Dilution next, each subsequent round reducing earlier investors’ stakes. Net profit in absolute terms — the value of the stake less the cost of the investment — rather than gross value or a multiple. The authors’ example: two investors each hold 10% of a company valued at $200 billion, a $20 billion stake in both cases; but the first paid $10 million for it and the second $10 billion. The first investor’s net profit approaches $20 billion, the second’s is only $10 billion: for an equal stake, the method rewards whoever invested early and cheaply. A 50% bonus for a board seat and 50% for leading a round, reflecting the investor’s contribution. A decay of human capital, with a three-year half-life counted from the date of investment rather than from the exit: an investment six years old is worth only a quarter of its initial weight, because the network, judgment and skills behind it date from then (on the weight of time in performance, see our analysis no. 18, in French). And a split of points between the individual and the firm, 75% for the former and 25% for the latter, in line with the share of performance the literature attributes to partners and to houses respectively.
This method, more explicit than that of Forbes, is not free of arbitrariness. Why assign human capital a three-year half-life? Saying that an investment made six years earlier counts for only a quarter of its initial value amounts to assuming that the judgment behind it has depreciated by 75%. In a business where companies often take ten years or more to reach maturity, that choice mechanically favors recent successes and penalizes patient investors. The 50% bonuses granted for a board seat and for leading a financing round raise a comparable difficulty. These responsibilities certainly signal involvement, but nothing shows that each raises an investor’s economic contribution by half. One partner may sit on a board without playing a decisive role, while another may exert a determining influence with no formal mandate. The transparency of a formula does not guarantee the relevance of its coefficients. To judge the robustness of the alternative ranking, one would need to know how far its results survive a change in those assumptions.
A distinction also has to be drawn between two measures that the vocabulary of performance tends to conflate. The net profit attributed to an investment, and by extension to the individual who made it, is not the net return of the fund that financed it. The latter is measured notably by the internal rate of return (IRR) and the multiple of invested capital (TVPI), calculated after management fees and carried interest when presented net. An investor may have taken part in several spectacular deals without the limited partners in his or her fund earning exceptional returns. The ranking therefore measures absolute value creation associated with individuals, not the financial performance actually delivered to fund investors. The distinction is no small matter: it is the latter that constitutes, for limited partners, the real result of the management.
Applied to 2023, across 232,000 financing rounds in 53,000 companies by nearly 13,000 American investors, this method produces a list that overlaps little with the Forbes one. Forty-one of its top hundred appear on the 2023 Midas List. Among those both lists place in the top 100, the rank correlation is 0.30, on the same 0-to-1 scale. Three of the top ten in the new ranking, five of the top twenty and twenty-seven of the top fifty are absent from the Forbes list. Conversely, 35 Americans on the 2023 Midas List do not appear in the alternative top 100. The authors stress that their method deliberately differs from that of Forbes, but that this difference cannot explain the gap, since their faithful replication of the Forbes method also produces a list far removed from the original. They note in passing the concentration their method reveals: the top hundred investors average 1,000 points, fifty times the mean, and for about 75% of financed companies the cost of investments exceeds the value of investors’ stakes.
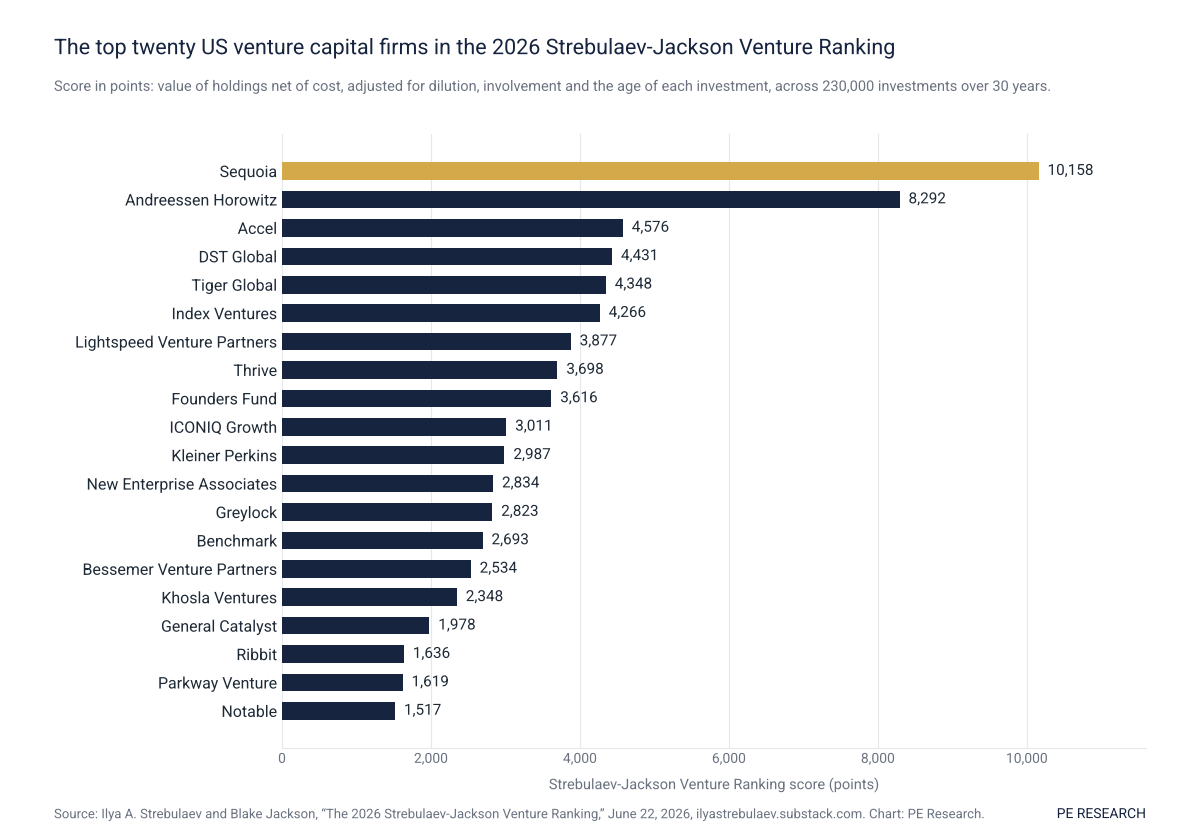
The first ranking produced by this method, covering American venture capital firms, was published on June 22, 2026. It puts Sequoia well ahead, with 10,158 points, followed by Andreessen Horowitz (8,292) and a cluster of four houses between 4,200 and 4,600 points; the hundredth firm scores 245. The individual ranking, which this chart does not cover, has yet to appear.
What the list does to those who make it
The NBER working paper asks a different question: not what the list is worth, but what it produces. The idea is to compare investors who just make it with those who just miss, whose trajectories ought to be similar if the list had no effect of its own. The replication described above makes it possible to identify, for each edition, the “surprises” — those who appear on the list without the reconstructed method predicting it, and those absent from it although the method placed them there — as well as the “marginals,” the last five or ten ranked against the first five or ten excluded. The fact that Forbes makes inclusions and exclusions for undeclared reasons strengthens, the authors note, the validity of this comparison.
The result runs counter to what research has established for corporate chief executives. In a reference study, “Superstar CEOs” (Quarterly Journal of Economics, 2009), Ulrike Malmendier and Geoffrey Tate tracked 264 American CEOs honored between 1975 and 2002 by a business-press award (Business Week, Forbes, Time, Chief Executive, among others) and compared them with executives of identical profile who should have received one but did not. Over the following three years, the award winners’ companies underperform comparable executives’ by 15% to 26%, their operating profitability falls by four points, while their compensation jumps about 44% in the award year, they write more books, sit on more outside boards and manage their earnings more, all of it concentrated in weakly governed firms. Media consecration, the authors conclude, costs shareholders.
For Private Equity funds, research finds neither this curse nor unbroken persistence, but a persistence that erodes. Harris, Jenkinson, Kaplan and Stucke, in “Has Persistence Persisted in Private Equity?” (2,222 American funds, 1984-2014 vintages), show that a manager whose previous fund finished in the top quartile places the next one in the top quartile 44.7% of the time in venture capital and 34.8% in buyout, against 25% if chance decided (on what separates the two segments, see our analysis no. 30); in venture capital, successors to top-quartile funds return 2.06 times the market, successors to bottom-quartile funds 0.67 times. But that calculation uses the previous fund’s final performance, which a limited partner does not know when asked to re-up: using only the information available at fundraising, the probability of staying in the top quartile falls to 32.9% in venture capital and 23.9% in buyout for post-2000 vintages — the level of chance. In buyout, persistence “disappeared” after 2000; in venture capital it survives, but the gap between successors to the best and the worst funds has narrowed from 2.50 against 0.91 before 2000 to 1.20 against 0.91 after. Korteweg and Sørensen, in “Skill and Luck in Private Equity Performance” (Journal of Financial Economics, 2017), explain why: skill exists, and it is worth 7 to 8 points of annual return between top- and bottom-quartile managers, but it is drowned in noise, which accounts for nearly 87% of return variance in venture capital. A top-quartile fund therefore signals a top-quartile manager only imperfectly: after five funds, the probability that the manager genuinely belongs in the upper quarter is only 37% in venture capital and 47% in buyout, and it would take twenty-five funds to be reasonably sure in venture capital, whereas 95% of venture firms have managed no more than five. Finally, Kaplan and Schoar (Journal of Finance, 2005) had shown that successful managers go on to raise larger funds, though less than proportionally to their lead, and that funds raised at the top of the cycle, when capital floods into the industry, subsequently do worse: it is the inflow of money, more than the size of any one fund, that dilutes success.
Three objects, three results: for CEOs, status degrades performance; for funds, success dilutes without reversing; for the individual investors of the Midas List, status improves it. For the last of these, marginal inclusion raises by 4 to 8 percentage points the probability of investing, in the following years, in a company that will succeed — an increase of about 10% relative to the sample mean, or 0.13 additional successful investments. It comes with about $6 million more invested per year, 40% of the mean, and $56 million in additional net profits on new investments. These profits are economic profits estimated by the authors from valuations and dilution, not net distributions to limited partners. In the narrowest window, between the last five ranked and the first five excluded, making the list raises by 14.3 points the probability of investing in a company that will later reach a $5 billion valuation, and by 11.6 points that of joining a round preceding an IPO. The effects are roughly twice as strong for these marginal cases as for the surprises at the top of the table: the list counts most for those who need it most.
One should nonetheless resist turning this statistical relationship into a general law. The comparison between investors admitted by a hair and investors excluded by a hair is a quasi-experimental method, not an experiment in which places were handed out at random. It rests on the assumption that the two populations are comparable enough for the difference in their trajectories to be attributed to the ranking. Yet the exact selection criteria remain unknown. The results thus offer a serious argument for an effect proper to reputation, but they demonstrate neither that this effect operates with the same intensity across all hundred honorees, nor that all the additional performance is attributable to it. What they establish above all is a local effect, in the neighborhood of the admission threshold, whose generalization calls for caution.
Where does the effect come from? Appearing on a list does not make anyone more skilled. The gain applies to new investments, in companies that go on to reach high valuations or go public, and not to high-multiple exits or to the existing portfolio, which would also benefit from any new resources. The authors conclude that media visibility opens access to sought-after rounds rather than bringing resources to companies already financed.
The caveats
Three caveats are in order. The first concerns the status of the texts: a working paper and a preliminary paper whose authors warn that the results may be adjusted. The second concerns their position: Jackson and Strebulaev have begun publishing their own ranking. The table of the top hundred American venture capital firms appeared on June 22, 2026 in Ilya Strebulaev’s newsletter, a ranking of the top hundred artificial-intelligence investors followed in October, and the authors announce annual publication, international coverage and the collection of verified submissions from investors. The general individual ranking, the one that would compete directly with the Midas List, was announced as coming “soon” on June 22; it had not appeared as of November 9, 2026, and no date has been given. We will follow its publication with interest. Their critique of the Midas List is also the prospectus of a competitor, which the reader should keep in mind. The third concerns the data: the alternative ranking covers only American investors, 24 of the 100 honorees of 2023 being excluded on that ground; the authors acknowledge that they probably underestimate pre-seed investors and investments outside the United States, and about one-third of the points go to “anonymous” investors, whose firm is known but not the individual partner. They further admit that part of the data submitted to Forbes — secondary valuations or internal marks — escapes them. None of these caveats touches the central result: the gap between the list and its reconstruction remains, by their own admission, “undoubtedly large and puzzling.”
The circle
Put end to end, the two papers describe a mechanism that neither states on its own. A ranking whose scoring is not public, fed by voluntary submissions and which the best reconstruction recovers only two-thirds of the way, hands out a status each year; that status then opens access to the most sought-after startups; those investments in turn feed the following year’s submissions. The persistence of individual performance in venture capital, documented for a decade, also runs through this channel. The authors see in it a new route by which the ability to make successful investments is acquired: reputation gives access to deal flow, and deal flow makes reputation.
This is perhaps the most important lesson of the two studies. In venture capital, reputation is not merely the consequence of success: it becomes one of its instruments. It gives access to the most sought-after entrepreneurs, an invitation to the most contested financing rounds, and the pick of investments others will never see. Renown thus constitutes an economic asset, capable of producing its own returns and entrenching established positions.
The question of a ranking’s reliability therefore goes beyond its statistical accuracy. A league table that shapes access to the best opportunities no longer merely describes a hierarchy: it helps to create one. And when its criteria remain partly opaque, that capacity to distribute economic advantages raises a question more fundamental than individual merit: the question of the power held by those who decide to whom reputation will be granted.
Sources
Blake Jackson and Ilya A. Strebulaev, “Human Capital in Venture Capital: Evidence From 100,000 Venture Capitalists”, NBER Working Paper no. 35501, July 2026: section 4, pp. 33-40.
Ilya A. Strebulaev and Blake Jackson, “Ranking Venture Investors”, SSRN no. 6833760, preliminary version of June 15, 2026: method pp. 2-15, 2023 results pp. 17-20, comparison with the Midas List pp. 20-26.
Ilya A. Strebulaev and Blake Jackson, “The 2026 Strebulaev-Jackson Venture Ranking: Complete Top 100 VC Firms”, Ilya Strebulaev’s newsletter (Substack), June 22, 2026; “How the Strebulaev-Jackson Venture Rankings Work”, methodology note, November 4, 2026; ranking of the top hundred individual artificial-intelligence investors, data as of August 31, 2026, reported by Poets&Quants, October 26, 2026.
Ulrike Malmendier and Geoffrey Tate, “Superstar CEOs”, Quarterly Journal of Economics, vol. 124, no. 4, 2009, pp. 1593-1638.
Robert S. Harris, Tim Jenkinson, Steven N. Kaplan and Rüdiger Stucke, “Has Persistence Persisted in Private Equity? Evidence from Buyout and Venture Capital Funds”, NBER Working Paper no. 28109: tables 3 to 5, pp. 10-15 and 27-34.
Arthur Korteweg and Morten Sørensen, “Skill and Luck in Private Equity Performance”, Journal of Financial Economics, vol. 124, no. 3, 2017, pp. 535-562.
Steven N. Kaplan and Antoinette Schoar, “Private Equity Performance: Returns, Persistence, and Capital Flows”, Journal of Finance, vol. 60, no. 4, 2005.
Forbes, Midas List (2026 edition published May 27, 2026) and 2023 list (PDF cited by the authors); description of the method on the list’s page and on the submission site submitmidasdata.com.